

THE NOURISHING EFFECT
HR2016-Full-Report-Web
HR2016-Full-Report-Web

You also want an ePaper? Increase the reach of your titles
YUMPU automatically turns print PDFs into web optimized ePapers that Google loves.
CHAPTER 1<br />
likely to be hospitalized than a similar group of children who were in child care but not<br />
receiving meals there. 63<br />
In policy debates about child nutrition programs, the Child and Adult Care Food Program<br />
(CACFP) rarely receives the attention that WIC or the National School Lunch Program<br />
does. That may change as national investments increase in early childhood development,<br />
which many policymakers recognize are becoming more<br />
Like food, shelter is such necessary for the United States to remain competitive in a<br />
a basic need that it is little global economy. CACFP currently serves 3.3 million lowincome<br />
children every day in early care and education pro-<br />
wonder it becomes the<br />
all-encompassing focus grams. 64 All of the children’s meals and snacks must meet<br />
of a homeless parent’s strict nutritional requirements. CACFP allows licensed<br />
life, crowding out other childcare centers, family childcare providers, after-school<br />
concerns.<br />
programs, and Head Start and Early Head Start programs<br />
to be reimbursed for the foods they serve. 65<br />
Bright Beginnings, an early education and childcare center in Washington, DC, uses<br />
CACFP to provide for the children it serves in its Early Head Start program. Bright Beginnings<br />
opened in 1994. It is unique among early education programs because the families it<br />
serves are homeless. All Head Start and Early Head Start programs are required to provide<br />
parent education and outreach activities related to health and other issues. At Bright Beginnings,<br />
the wrap-around services provided take this to a higher level. This is the quintessential<br />
two-generation approach to fighting poverty. The families at Bright Beginnings are among<br />
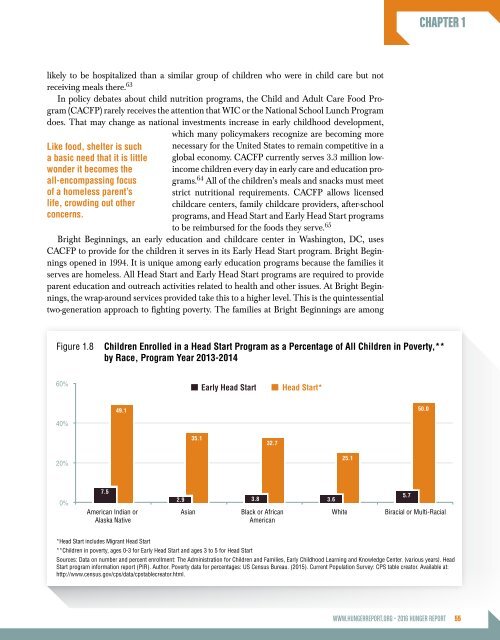
Figure 1.8<br />
Children Enrolled in a Head Start Program as a Percentage of All Children in Poverty,**<br />
by Race, Program Year 2013-2014<br />
60%<br />
Early Head Start<br />
Head Start*<br />
49.1<br />
50.0<br />
40%<br />
35.1<br />
32.7<br />
20%<br />
25.1<br />
0%<br />
7.5<br />
American Indian or<br />
Alaska Native<br />
2.9 3.8 3.6<br />
Asian<br />
Black or African<br />
American<br />
White<br />
5.7<br />
Biracial or Multi-Racial<br />
*Head Start includes Migrant Head Start<br />
**Children in poverty, ages 0-3 for Early Head Start and ages 3 to 5 for Head Start<br />
Sources: Data on number and percent enrollment: The Administration for Children and Families, Early Childhood Learning and Knowledge Center. {various years}. Head<br />
Start program information report (PIR). Author. Poverty data for percentages: US Census Bureau. (2015). Current Population Survey: CPS table creator. Available at:<br />
http://www.census.gov/cps/data/cpstablecreator.html.<br />
WWW.HUNGERREPORT.ORG • 2016 HUNGER REPORT 55