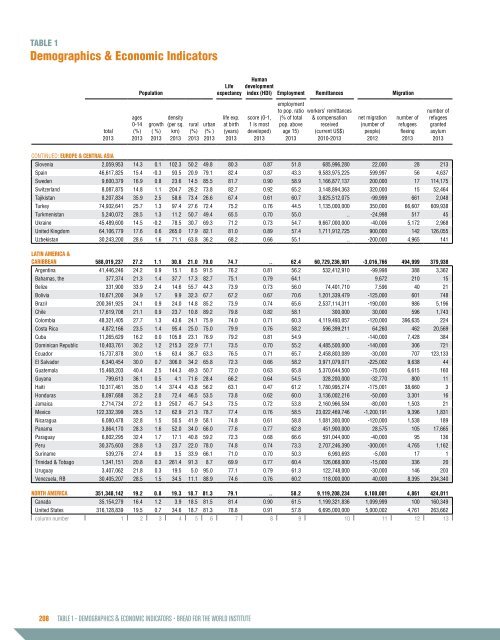
TABLE 1 Demographics & Economic Indicators Population Human Life expectancy development index (HDI) Employment Remittances Migration employment to pop. ratio (% of total pop. above workers’ remittances & compensation received number of refugees granted asylum ages 0-14 density growth (per sq. rural urban life exp. at birth score (0-1, 1 is most net migration (number of number of refugees total (%) ( %) km) (%) (% ) (years) developed) age 15) (current US$) people) fleeing 2013 2013 2013 2013 2013 2013 2013 2013 2013 2010-2013 2012 2013 2013 CONTINUED: EUROPE & CENTRAL ASIA Slovenia 2,059,953 14.3 0.1 102.3 50.2 49.8 80.3 0.87 51.8 685,996,280 22,000 28 213 Spain 46,617,825 15.4 -0.3 93.5 20.9 79.1 82.4 0.87 43.3 9,583,975,225 599,997 56 4,637 Sweden 9,600,379 16.9 0.8 23.6 14.5 85.5 81.7 0.90 58.9 1,166,877,137 200,000 17 114,175 Switzerland 8,087,875 14.8 1.1 204.7 26.2 73.8 82.7 0.92 65.2 3,148,894,363 320,000 15 52,464 Tajikistan 8,207,834 35.9 2.5 58.6 73.4 26.6 67.4 0.61 60.7 3,625,512,075 -99,999 661 2,048 Turkey 74,932,641 25.7 1.3 97.4 27.6 72.4 75.2 0.76 44.5 1,135,000,000 350,000 66,607 609,938 Turkmenistan 5,240,072 28.5 1.3 11.2 50.7 49.4 65.5 0.70 55.0 .. -24,998 517 45 Ukraine 45,489,600 14.5 -0.2 78.5 30.7 69.3 71.2 0.73 54.7 9,667,000,000 -40,006 5,172 2,968 United Kingdom 64,106,779 17.6 0.6 265.0 17.9 82.1 81.0 0.89 57.4 1,711,912,725 900,000 142 126,055 Uzbekistan 30,243,200 28.6 1.6 71.1 63.8 36.2 68.2 0.66 55.1 .. -200,000 4,965 141 LATIN AMERICA & CARIBBEAN 588,019,237 27.2 1.1 30.8 21.0 79.0 74.7 .. 62.4 60,729,236,901 -3,016,766 494,999 379,938 Argentina 41,446,246 24.2 0.9 15.1 8.5 91.5 76.2 0.81 56.2 532,412,910 -99,998 388 3,362 Bahamas, the 377,374 21.3 1.4 37.7 17.3 82.7 75.1 0.79 64.1 .. 9,672 210 15 Belize 331,900 33.9 2.4 14.6 55.7 44.3 73.9 0.73 56.0 74,401,710 7,596 40 21 Bolivia 10,671,200 34.9 1.7 9.9 32.3 67.7 67.2 0.67 70.6 1,201,339,479 -125,000 601 748 Brazil 200,361,925 24.1 0.9 24.0 14.8 85.2 73.9 0.74 65.6 2,537,114,311 -190,000 986 5,196 Chile 17,619,708 21.1 0.9 23.7 10.8 89.2 79.8 0.82 58.1 300,000 30,000 596 1,743 Colombia 48,321,405 27.7 1.3 43.6 24.1 75.9 74.0 0.71 60.3 4,119,493,057 -120,000 396,635 224 Costa Rica 4,872,166 23.5 1.4 95.4 25.0 75.0 79.9 0.76 58.2 596,399,211 64,260 462 20,569 Cuba 11,265,629 16.2 0.0 105.8 23.1 76.9 79.2 0.81 54.9 .. -140,000 7,428 384 Dominican Republic 10,403,761 30.2 1.2 215.3 22.9 77.1 73.5 0.70 55.2 4,485,500,000 -140,000 306 721 Ecuador 15,737,878 30.0 1.6 63.4 36.7 63.3 76.5 0.71 65.7 2,458,803,089 -30,000 707 123,133 El Salvador 6,340,454 30.0 0.7 306.0 34.2 65.8 72.3 0.66 58.2 3,971,079,071 -225,002 9,638 44 Guatemala 15,468,203 40.4 2.5 144.3 49.3 50.7 72.0 0.63 65.8 5,370,644,500 -75,000 6,615 160 Guyana 799,613 36.1 0.5 4.1 71.6 28.4 66.2 0.64 54.5 328,200,000 -32,770 800 11 Haiti 10,317,461 35.0 1.4 374.4 43.8 56.2 63.1 0.47 61.2 1,780,995,274 -175,001 38,660 3 Honduras 8,097,688 35.2 2.0 72.4 46.5 53.5 73.8 0.62 60.0 3,136,002,216 -50,000 3,301 16 Jamaica 2,714,734 27.2 0.3 250.7 45.7 54.3 73.5 0.72 53.8 2,160,966,584 -80,000 1,503 21 Mexico 122,332,399 28.5 1.2 62.9 21.3 78.7 77.4 0.76 58.5 23,022,469,746 -1,200,191 9,396 1,831 Nicaragua 6,080,478 32.8 1.5 50.5 41.9 58.1 74.8 0.61 58.8 1,081,300,000 -120,000 1,538 189 Panama 3,864,170 28.3 1.6 52.0 34.0 66.0 77.6 0.77 62.8 451,900,000 28,575 105 17,665 Paraguay 6,802,295 32.4 1.7 17.1 40.8 59.2 72.3 0.68 66.6 591,044,000 -40,000 95 136 Peru 30,375,603 28.8 1.3 23.7 22.0 78.0 74.8 0.74 73.3 2,707,246,390 -300,001 4,765 1,162 Suriname 539,276 27.4 0.9 3.5 33.9 66.1 71.0 0.70 50.3 6,993,693 -5,000 17 1 Trinidad & Tobago 1,341,151 20.8 0.3 261.4 91.3 8.7 69.9 0.77 60.4 126,068,000 -15,000 336 20 Uruguay 3,407,062 21.8 0.3 19.5 5.0 95.0 77.1 0.79 61.3 122,748,000 -30,000 146 203 Venezuela, RB 30,405,207 28.5 1.5 34.5 11.1 88.9 74.6 0.76 60.2 118,000,000 40,000 8,395 204,340 NORTH AMERICA 351,348,142 19.2 0.8 19.3 18.7 81.3 79.1 .. 58.2 9,119,208,234 6,100,001 4,861 424,011 Canada 35,154,279 16.4 1.2 3.9 18.5 81.5 81.4 0.90 61.5 1,199,321,836 1,099,999 100 160,349 United States 316,128,839 19.5 0.7 34.6 18.7 81.3 78.8 0.91 57.8 6,695,000,000 5,000,002 4,761 263,662 column number 1 2 3 4 5 6 7 8 9 10 11 12 13 208 TABLE 1 – DEMOGRAPHICS & ECONOMIC INDICATORS • BREAD FOR <strong>THE</strong> WORLD INSTITUTE
TABLE 1 Demographics & Economic Indicators Gross domestic product Military spending Debt & inflation value of external debt (current annual inflation, consumer Exports & imports of goods & services Exports & imports of food exports (% of merchan- Income inequality GINI* index, scale (0-100, 100 is maximal inequality) imports (% of merchan- GDP (current million US$) growth (%) per capita (current US$) per capita PPP † (current int’l $) % of gov’t spending million US$) prices (%) exports (% of GDP) imports (% of GDP) dise) dise) 2012-2013 2012-2013 2012-2013 2012-2013 2009-2013 2013 2011-2013 2011-2013 2009-2013 2009-2013 2009-2013 2009-2012 CONTINUED: EUROPE & CENTRAL ASIA Slovenia 47,987 -1.0 23,295 28,859 2.8 .. 1.8 74.7 68.7 4.0 8.4 24.9 Spain 1,393,040 -1.2 29,882 33,094 3.1 .. 1.4 31.6 28.1 15.3 11.1 35.8 Sweden 579,680 1.5 60,381 44,658 3.7 .. 0.0 43.8 38.9 5.8 10.4 .. Switzerland 685,434 1.9 84,748 56,950 4.3 .. -0.2 72.1 60.0 4.0 6.0 .. Tajikistan 8,508 7.4 1,037 2,512 .. 2,358 5.0 19.2 68.3 .. .. 30.8 Turkey 822,135 4.1 10,972 18,783 6.8 351,054 7.5 25.6 32.2 11.2 4.6 40.0 Turkmenistan 41,851 10.2 7,987 14,004 .. 298 .. 73.3 44.4 .. .. .. Ukraine 177,431 1.9 3,900 8,790 6.4 120,136 -0.3 46.9 55.4 26.8 10.3 24.8 United Kingdom 2,678,455 1.7 41,781 38,259 5.3 .. 2.6 29.8 31.7 8.0 13.4 38.0 Uzbekistan 56,796 8.0 1,878 5,168 .. 6,047 .. 27.7 31.6 .. .. .. LATIN AMERICA & CARIBBEAN 5,657,372 2.5 9,621 14,517 .. .. 3.3 22.5 24.4 21.7 7.0 .. Argentina 609,889 2.9 14,715 .. .. 103,922 .. 14.5 14.8 55.2 2.3 43.6 Bahamas, the 8,420 0.7 22,312 23,264 .. .. 0.4 42.0 55.8 25.2 16.1 .. Belize 1,624 1.5 4,894 8,487 4.3 925 0.7 60.9 66.3 76.6 14.1 .. Bolivia 30,601 6.8 2,868 6,131 .. 4,189 5.7 44.2 37.2 16.8 6.7 46.6 Brazil 2,245,673 2.5 11,208 15,037 5.7 409,134 6.2 12.6 15.0 34.3 4.9 52.7 Chile 277,199 4.1 15,732 21,942 10.1 .. 1.8 32.6 32.9 21.0 7.7 50.8 Colombia 378,415 4.7 7,831 12,424 12.6 78,035 2.0 17.8 20.2 9.2 10.0 53.5 Costa Rica 49,621 3.5 10,185 13,876 .. 14,302 5.2 35.1 38.7 34.5 10.5 48.6 Cuba 68,234 c 2.7 c 6,051 18,796 .. .. .. 20.0 19.1 .. .. .. Dominican Republic 61,164 4.6 5,879 12,186 4.3 17,898 4.8 25.5 31.2 21.7 13.5 45.7 Ecuador 94,473 4.6 6,003 10,890 .. 14,728 2.7 29.2 31.6 31.1 7.3 46.6 El Salvador 24,259 1.7 3,826 7,764 5.6 11,030 0.8 26.4 45.8 21.9 15.2 41.8 Guatemala 53,797 3.7 3,478 7,297 3.4 13,177 4.3 23.7 35.0 43.9 13.3 52.4 Guyana 2,990 5.2 3,739 6,546 .. 1,444 1.8 .. .. 64.0 15.6 .. Haiti 8,459 4.3 820 1,703 .. 977 5.9 18.2 52.9 .. .. .. Honduras 18,550 2.6 2,291 4,593 4.3 3,048 5.2 47.9 69.5 56.9 16.7 57.4 Jamaica 14,362 1.3 5,290 8,893 2.7 12,670 9.3 30.4 53.0 21.5 17.4 .. Mexico 1,260,915 1.1 10,307 16,370 .. 390,245 3.8 31.7 32.4 6.4 6.6 48.1 Nicaragua 11,256 4.6 1,851 4,643 4.4 6,103 7.1 40.5 52.1 49.3 17.2 45.7 Panama 42,648 8.4 11,037 19,416 .. 13,267 4.0 79.8 75.0 67.1 13.8 51.9 Paraguay 29,009 14.2 4,265 8,093 6.5 9,922 2.7 49.4 44.7 65.3 8.0 48.0 Peru 202,350 5.8 6,662 11,774 7.4 50,596 2.8 23.7 24.6 19.9 9.8 45.3 Suriname 5,299 2.9 9,826 16,071 .. .. 2.0 .. .. 1.8 14.3 .. Trinidad & Tobago 24,641 1.6 18,373 30,446 4.0 .. 5.2 63.2 40.0 2.5 11.2 .. Uruguay 55,708 4.4 16,351 19,594 6.2 .. 8.6 24.0 27.3 66.7 11.3 41.3 Venezuela, RB 438,284 1.3 14,415 18,198 .. 108,723 40.6 26.2 24.2 0.1 14.7 .. NORTH AMERICA 18,600,528 2.2 52,940 52,013 15.1 .. 1.2 14.7 17.7 10.4 5.7 .. Canada 1,826,769 2.0 51,964 42,753 5.9 .. 0.9 30.1 31.8 10.7 7.6 33.7 United States 16,768,100 2.2 53,042 53,042 16.5 .. 1.5 13.5 16.5 10.2 5.3 41.1 column number 14 15 16 17 18 19 20 21 22 23 24 25 .. Data not available. 0 Zero, or rounds to zero at displayed number of decimal. a Data refers to 2009. b Data refers to 2010. Sources for tables on page 235. c Data refers to 2011. d Data refers to 2012. e Data refers to 2013. f Data refers to 2014. † Purchasing Power Parity: a method of currency conversion that equalizes the purchasing power of different currencies. * GINI index measures the extent to which the distribution of income or consumption expenditure among individuals or households within an economy deviates from a perfectly equal distribution. WWW.HUNGERREPORT.ORG • 2016 HUNGER REPORT 209
- Page 1:
THE NOURISHING EFFECT: 2016 HUNGER
- Page 4 and 5:
BREAD FOR THE WORLD INSTITUTE Presi
- Page 6 and 7:
Table of Contents Foreword by David
- Page 8 and 9:
Table of Contents Appendix 1: Feder
- Page 10 and 11:
Foreword: David Beckmann In 2015, w
- Page 12 and 13:
2 EXECUTIVE SUMMARY • BREAD FOR T
- Page 14 and 15:
Courtesy Meals on Wheels Introducti
- Page 16 and 17:
Joseph Molieri/Bread for the World
- Page 18 and 19:
Box ES.1 Conclusion A Transformatio
- Page 20 and 21:
10 INTRODUCTION • BREAD FOR THE W
- Page 22 and 23:
USDA Photo by Lance Cheung School m
- Page 24 and 25:
Figure i.2 Worsening of Competing D
- Page 26 and 27:
Zach Blum for Bread for the World T
- Page 28 and 29:
Laura Elizabeth Pohl for Bread for
- Page 30 and 31:
USDA photo President Johnson signin
- Page 32 and 33:
WIC agency reaches its maximum case
- Page 34 and 35:
Figure i.7 gress banned use of lead
- Page 36 and 37:
Box i.2 THE FOOD ENVIRONMENT IN LAT
- Page 38 and 39:
Rick Reinhard for Bread for the Wor
- Page 40 and 41:
Box i.3 MASS INCARCERATION: A PUBLI
- Page 42 and 43:
Over the last 30 years, prices for
- Page 44 and 45:
For decades, in both the public and
- Page 46 and 47:
healthcare system in the United Sta
- Page 48 and 49:
THE HUMAN RIGHT TO WATER IN THE UNI
- Page 50 and 51:
40 CHAPTER 1 • BREAD FOR THE WORL
- Page 52 and 53:
Figure 1.1 RATE OF RETURN TO INVEST
- Page 54 and 55:
Figure 1.2 10% 5% 0% Percentage of
- Page 56 and 57:
Home visitation programs are unique
- Page 58 and 59:
Figure 1.4 children healthy. Cold,
- Page 60 and 61:
Courtesy Children’s HealthWatch D
- Page 62 and 63:
Richard Lord Residents at a shelter
- Page 64 and 65:
Figure 1.7 Percent of Patients 100
- Page 66 and 67:
Todd Post/Bread for the World Growi
- Page 68 and 69:
U.S. Department of Health and Human
- Page 70 and 71:
to six times the average for their
- Page 72 and 73:
New York City Department of Transpo
- Page 74 and 75:
Box 1.3 COMMUNITY SERVINGS: IS IT N
- Page 76 and 77:
in the most recent edition of the a
- Page 78 and 79:
Figure 1.14 Long-Term Services and
- Page 80 and 81:
HUNGER AND FOOD INSECURITY DRIVE UP
- Page 82 and 83:
72 CHAPTER 2 • BREAD FOR THE WORL
- Page 84 and 85:
Joseph Molieri/Bread for the World
- Page 86 and 87:
Zach Blum for Bread for the World A
- Page 88 and 89:
Box 2.1 ESKENAZI HEALTH CARES ABOUT
- Page 90 and 91:
Joseph Molieri/Bread for the World
- Page 92 and 93:
Figure 2.3 Figure 2.4 Total Fruit C
- Page 94 and 95:
Box 2.2 MCKENNA’S WAGON AT MARTHA
- Page 96 and 97:
Figure 2.5 Millions $20 $15 $10 $5
- Page 98 and 99:
Box 2.3 FAITH, FOOD, AND COMMUNITY
- Page 100 and 101:
U.S. farmers producing foods aligne
- Page 102 and 103:
Joseph Molieri/Bread for the World
- Page 104 and 105:
Box 2.4 SUSTAINABLE WILLIAMSON, WES
- Page 106 and 107:
No discussion of the anti-hunger in
- Page 108 and 109:
Joseph Molieri/Bread for the World
- Page 110 and 111:
Box 2.5 MEANS AGAINST THE CLOCK Jos
- Page 112 and 113:
Zach Blum for Bread for the World E
- Page 114 and 115:
Figure 2.11 Industry With the Highe
- Page 116 and 117:
‘FOOD IS MEDICINE’ IN NAVAJO NA
- Page 118 and 119:
108 CHAPTER 3 • BREAD FOR THE WOR
- Page 120 and 121:
Erly Tatontos/World Bank Indonesian
- Page 122 and 123:
Danilo Pinzon/World Bank Most hungr
- Page 124 and 125:
Natalia Cieslik/World Bank In Gaza,
- Page 126 and 127:
USAID In Senegal, a community-based
- Page 128 and 129:
consequences can appear at any age.
- Page 130 and 131:
A mother and child at an outpatient
- Page 132 and 133:
must strengthen health systems, so
- Page 134 and 135:
Maria Fleischmann/World Bank A youn
- Page 136 and 137:
Box 3.1 U.S. LEADERSHIP: ENDING PRE
- Page 138 and 139:
Graham Crouch/World Bank In Afghani
- Page 140 and 141:
Arne Hoel/World Bank Access to clea
- Page 142 and 143:
Box 3.2 THE ROLE OF DOMESTIC RESOUR
- Page 144 and 145:
Thomas Sennett/World Bank Farmers p
- Page 146 and 147:
Dominic Chavez/World Bank A mother
- Page 148 and 149:
THE NUTRITION VISION OF THE 2030 AG
- Page 150 and 151:
A TRANSFORMATIONAL AGENDA by Asma L
- Page 152 and 153:
CHRISTIAN STUDY GUIDE LEADER'S RESO
- Page 154 and 155:
CHRISTIAN STUDY GUIDE hour to 90 mi
- Page 156 and 157:
CHRISTIAN STUDY GUIDE SESSION 1: HE
- Page 158 and 159:
CHRISTIAN STUDY GUIDE How much and
- Page 160 and 161:
CHRISTIAN STUDY GUIDE SESSION 2: HO
- Page 162 and 163:
CHRISTIAN STUDY GUIDE aspect of thi
- Page 164 and 165:
CHRISTIAN STUDY GUIDE SESSION 3: TH
- Page 166 and 167:
CHRISTIAN STUDY GUIDE government me
- Page 168 and 169: CHRISTIAN STUDY GUIDE SESSION 4: EN
- Page 170 and 171: CHRISTIAN STUDY GUIDE donor nations
- Page 172 and 173: Endnotes Introduction (pages 10-39)
- Page 174 and 175: Education: Socioeconomic Status Gra
- Page 176 and 177: Shorter Lives, Poorer Health, p. 65
- Page 178 and 179: South and Appalachia,” Center on
- Page 180 and 181: 8 Sara Rosenbaum et al. (July 2015)
- Page 182 and 183: (June 2013). All quotes attributed
- Page 184 and 185: 44 See Note 41. 45 Will Dunham (May
- Page 186 and 187: Nature Volume 493, Issue 7430. 137
- Page 188 and 189: Food bank: A charitable organizatio
- Page 190 and 191: Scaling Up Nutrition (SUN) movement
- Page 192 and 193: WIC Program—serves to safeguard t
- Page 194 and 195: peer-reviewed academic journals bet
- Page 196 and 197: Background and Context A Note on Hu
- Page 198 and 199: ature indicates it is strongly rela
- Page 200 and 201: staying above 15 million until May
- Page 202 and 203: high prevalence of food insecurity
- Page 204 and 205: a daily basis as to whether they ar
- Page 206 and 207: References 1. Shepard D, Setren E,
- Page 208 and 209: Exhibit A1 Health conditions for wh
- Page 210 and 211: Exhibit A2 Detailed description of
- Page 212 and 213: TABLE 1 Demographics & Economic Ind
- Page 214 and 215: TABLE 1 Demographics & Economic Ind
- Page 216 and 217: TABLE 1 Demographics & Economic Ind
- Page 220 and 221: TABLE 2 MDG 1: Eradicate Extreme Po
- Page 222 and 223: TABLE 2 MDG 1: Eradicate Extreme Po
- Page 224 and 225: TABLE 3 MDG 1: Eradicate Extreme Hu
- Page 226 and 227: TABLE 4 MDG 2: Achieve Universal Pr
- Page 228 and 229: TABLE 4 MDG 2: Achieve Universal Pr
- Page 230 and 231: TABLE 6 MDG 4: Reduce Child Mortali
- Page 232 and 233: TABLE 8 MDG 6: Combat HIV/AIDS, Mal
- Page 234 and 235: TABLE 8 MDG 6: Combat HIV/AIDS, Mal
- Page 236 and 237: TABLE 9 MDG 7: Ensure Environmental
- Page 238 and 239: TABLE 10 MDG 8: Develop a Global Pa
- Page 240 and 241: TABLE 10 MDG 8: Develop a Global Pa
- Page 242 and 243: TABLE 12 United States: National Hu
- Page 244 and 245: TABLE 13 United States Hunger, Pove
- Page 246 and 247: Sources for Data Tables TABLE 10 MD
- Page 248 and 249: Community of Christ engages the chu
- Page 250 and 251: Acknowledgements Bread for the Worl
- Page 252 and 253: Index 1,000 days, 116 401(k)/IRA, 6
- Page 254 and 255: Fathalla, Mahmoud, 120 Federal Home
- Page 256 and 257: Medicare, 14, 29, 33, 41, 54, 62, 6
- Page 258: Sustainable Development Goals (SDGs