

THE NOURISHING EFFECT
HR2016-Full-Report-Web
HR2016-Full-Report-Web

Create successful ePaper yourself
Turn your PDF publications into a flip-book with our unique Google optimized e-Paper software.
INTRODUCTION<br />
Not everyone agrees hunger and<br />
food insecurity are pressing problems<br />
in the United States. Skeptics<br />
contend the official data overstate<br />
the actual levels of hardship in the<br />
country. 16,17 But according to Mark<br />
Nord and Alisha Coleman-Jensen,<br />
very low food insecurity may actually<br />
be understated among households<br />
with children. 18 In USDA interviews<br />
with families receiving food assistance,<br />
researchers found “adults in<br />
the study, including those who are<br />
food secure by our survey measure,<br />
have skipped meals so often and<br />
for such a long time, that it is not<br />
described as anything out of the<br />
ordinary; in fact, it is seldom even<br />
conceived of as a hardship.” 19 Mariana<br />
Chilton and Jenny Rabinowich<br />
explain also, “Caregivers are often<br />
reluctant to admit that their children<br />
may not be getting enough food due<br />
to shame or due to the fear that their<br />
children might be removed from the<br />
home by authorities.” 20<br />
Households with children are<br />
categorized as food insecure if they<br />
answer three or more of the survey<br />
questions affirmatively. The survey<br />
consists of 18 questions (or 10 questions<br />
for households without children).<br />
Questions include: “In the<br />
last 12 months, were the children<br />
ever hungry but you just couldn’t<br />
afford more food?” (Yes/No), and<br />
“In the last 12 months, did any of<br />
the children ever not eat for a whole<br />
day because there wasn’t enough<br />
money for food?” (Yes/No). 21<br />
At the World Food Summit in<br />
1996, the international community<br />
agreed on the following definition<br />
of food security: “when all people<br />
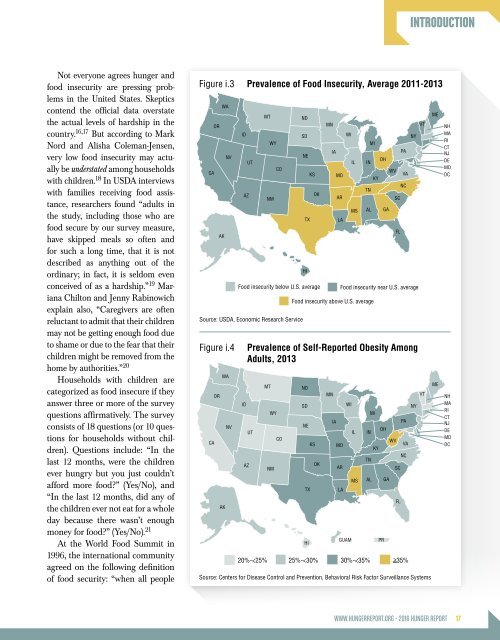
Figure i.3 Prevalence of Food Insecurity, Average 2011-2013<br />
CA<br />
OR<br />
AK<br />
WA<br />
NV<br />
ID<br />
AZ<br />
UT<br />
MT<br />
WY<br />
NM<br />
CO<br />
Source: USDA, Economic Research Service<br />
Figure i.4<br />
CA<br />
OR<br />
WA<br />
AK<br />
NV<br />
ND<br />
SD<br />
NE<br />
TX<br />
HI<br />
KS<br />
OK<br />
Food insecurity below U.S. average<br />
ID<br />
AZ<br />
UT<br />
MT<br />
WY<br />
NM<br />
CO<br />
Source: Centers for Disease Control and Prevention, Behavioral Risk Factor Surveillance Systems<br />
MN<br />
IA<br />
MO<br />
AR<br />
LA<br />
WI<br />
IL<br />
MS<br />
IN<br />
TN<br />
AL<br />
Food insecurity above U.S. average<br />
ND<br />
SD<br />
NE<br />
TX<br />
KS<br />
OK<br />
MN<br />
IA<br />
MO<br />
AR<br />
MI<br />
KY<br />
OH<br />
GA<br />
WV<br />
SC<br />
FL<br />
PA<br />
VA<br />
NC<br />
NY<br />
Food insecurity near U.S. average<br />
Prevalence of Self-Reported Obesity Among<br />
Adults, 2013<br />
HI<br />
LA<br />
WI<br />
GUAM<br />
20%-