

INTENSIVE CARE
8dI2AMDUa
8dI2AMDUa

Create successful ePaper yourself
Turn your PDF publications into a flip-book with our unique Google optimized e-Paper software.
Table 3 The fraction of dead/enrolled children by place o<br />
Lund et al. BMC Pediatrics 2014, 14:214 Table 3 The fraction of dead/enrolled children by Page place 7 of of 11<br />
enrolment, month of enrolment, and randomisation group<br />
http://www.biomedcentral.com/1471-2431/14/214<br />
enrolment, month of enrolment, and randomisation group<br />
No. of deaths/enrolled (% dead)<br />
No. of deaths/enrolled (% dead)<br />
Enrolled Enrolled at neonatal<br />
neonatal Enrolled at maternity Enrolled at maternity<br />
nursery nursery ward or health ward centres or health centre<br />
Table 3 The fraction of dead/enrolled children by place of<br />
Month of enrolment VAS OPV VAS OPV<br />
enrolment,<br />
Month of<br />
month<br />
enrolment<br />
of enrolment,<br />
VAS<br />
and randomisation<br />
OPV VAS<br />
group<br />
OPV<br />
February 0/0 (0) 1/2 (50) 0/4 (0) 1/4 (25)<br />
February No. 0/0 of deaths/enrolled (0) 1/2 (50) (% dead) 0/4 (0) 1/4 (25)<br />
March 2/3 (67) 0/4 (0) 0/11 (0) 1/10 (10)<br />
March Enrolled 2/3 at neonatal (67) 0/4 Enrolled (0) at maternity 0/11 (0) 1/10 (10)<br />
April 2/6 (33) nursery 1/4 (25) ward 0/8 (0) or health 1/10 centres (10)<br />
April 2/6 (33) 1/4 (25) 0/8 (0) 1/10 (10)<br />
Month May of enrolment 0/5 VAS (0) 3/4 OPV (75) 1/9 VAS (11) 1/7 OPV (14)<br />
February Total, May dry season 4/14 0/0 (29) (0) 0/55/14 1/2 (0)(50) (36) 3/4 1/32 0/4 (75) (0) (3) 1/9 4/31 1/4 (11) (25) (13) 1/7 (14)<br />
June March Total, dry season 2/3 0/2 (67) (0) 4/140/4 (29) (0) 5/14 0/11 0/5 (36) (0) 1/32 1/10 0/6 (10) (0) (3) 4/31 (13)<br />
July April<br />
June 1/3 2/6 (33) 1/4 0/1 (25)<br />
0/2 (0) (0) 1/6 0/8 (17) (0)<br />
0/4 (0)<br />
1/10 0/8 (10)<br />
0/5 (0) 0/6 (0)<br />
August May 1/2 0/5 (50) (0) 3/4 0/2 (75) (0) 1/9 0/8 (11) (0) 1/7 0/5 (14) (0)<br />
July 1/3 (33) 0/1 (0) 1/6 (17) 0/8 (0)<br />
September Total, dry season 4/14 5/6 (83) (29) 5/14 1/6 (17) (36) 1/32 1/9 (11) (3) 4/31 0/9 (13) (0)<br />
August 1/2 (50) 0/2 (0) 0/8 (0) 0/5 (0)<br />
October June 0/4 0/2 (0) 0/0 0/4 (0) 0/17 0/5 (0) 0/20 0/6 (0)<br />
November JulySeptember 1/3 0/0 (33) (0) 5/6 0/1 0/3 (83)(0) 1/6 1/6 0/8 (17) (0) 1/9 0/8 0/7 (11) (0)<br />
0/9 (0)<br />
Total, August October rainy season 7/17 1/2 (50) (41) 0/41/16 0/2 (0) (0) (6) 0/0 2/53 0/8 (0) (4) 0/17 0/55 (0) 0/20 (0)<br />
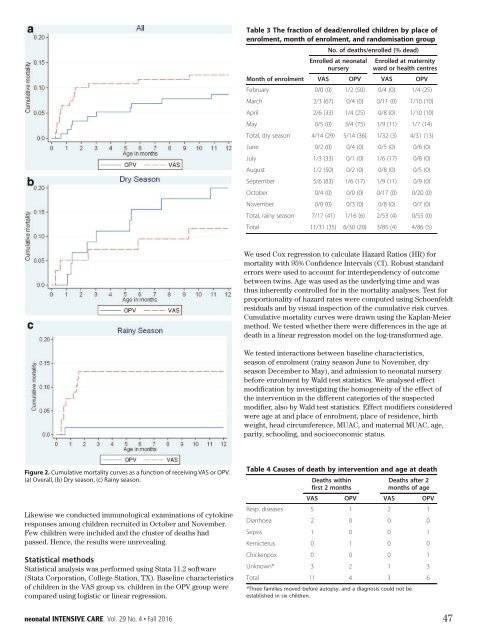
Figure 2 Cumulative mortality curves as a function of receiving<br />
VAS or OPV. (a) Overall, (b) Dry season, (c) Rainy season.<br />
respiratory diseases [21]. However, VAS was not harmful.<br />
The effect of OPV0 on growth has not been studied before.<br />
Figure 2 Cumulative mortality curves as a function of receiving<br />
VAS or OPV. (a) Overall, (b) Dry season, (c) Rainy season.<br />
Figure Chance 2. 2 Cumulative or cluster mortality mortality curves curves as a function as a function of receiving of VAS receiving or OPV.<br />
(a) Overall, The(b) sudden Dry season, increase (c) Rainy in season.<br />
VAS or the number of deaths among<br />
respiratory<br />
OPV. (a) Overall,<br />
diseases<br />
(b)<br />
[21].<br />
Dry season,<br />
However,<br />
(c) Rainy<br />
VAS was<br />
season.<br />
not harmful.<br />
boys who had received VAS and who had been in contact<br />
The effect of OPV0 on growth has not been studied before.<br />
with the neonatal nursery made us speculate that they had<br />
been infected with a pathogen that either interacted negativelyamong<br />
with VAS children or was recruited dealt better in October with byand OPV November. vaccinated<br />
Likewise Chance we conducted or cluster immunological examinations of cytokine<br />
responses The sudden increase in the number of deaths among<br />
Few children boys. Awere pathogen included could and the easily cluster haveof spread deaths had among the<br />
boys who had received VAS and who had been in contact<br />
passed. children Hence, through the results thewere suboptimal unrevealing. hygienic conditions. We<br />
Chancewith or cluster the neonatal nursery made us speculate that they had<br />
could not identify any likely pathogen or immunological<br />
been infected with a pathogen that either interacted negatively<br />
statistical methods<br />
Statistical analysis<br />
with VAS<br />
was<br />
or<br />
performed<br />
was dealt better<br />
using Stata<br />
with<br />
11.2<br />
by OPV<br />
software<br />
vaccinated<br />
(Stata boys. Corporation, A pathogen College could Station, easily TX). have Baseline spread characteristics among the<br />
of children children in the through VAS group the suboptimal vs. children hygienic in the OPV conditions. group were We<br />
compared couldusing not logistic identifyor any linear likely regression. pathogen or immunological<br />
respiratory diseases [21]. However, VAS was not harmful.<br />
The effect of OPV0 on growth has not been studied before.<br />
The sudden increase in the number of deaths among<br />
boys who had received VAS and who had been in contact<br />
with the neonatal nursery made us speculate that they had<br />
been infected with a pathogen that either interacted negatively<br />
with VAS or was dealt better with by OPV vaccinated<br />
boys. A pathogen could easily have spread among the<br />
children through the suboptimal hygienic conditions. We<br />
Total September November 11/31 5/6 (83) (35) 0/06/30 1/6 (0)(17) (20) 0/3 3/85 1/9 (0) (11) (4) 0/8 4/86 0/9 (0) (5) 0/7 (0)<br />
October 0/4 (0) 0/0 (0)<br />
Total, rainy season 7/17 (41)<br />
0/17 (0)<br />
1/16 (6)<br />
0/20 (0)<br />
2/53 (4) 0/55 (0)<br />
November 0/0 (0) 0/3 (0) 0/8 (0) 0/7 (0)<br />
We differences used Total Cox between regression theto two 11/31 calculate groups (35) Hazard which 6/30 (20) Ratios could(HR) 3/85 explain (4) for 4/86 (5)<br />
mortality<br />
Total, rainy<br />
with<br />
season<br />
95% Confidence<br />
7/17 (41)<br />
Intervals<br />
1/16 (6)<br />
(CI).<br />
2/53 (4)<br />
Robust<br />
0/55<br />
standard<br />
(0)<br />
the cluster, but this is perhaps not surprising as the mortality<br />
was no longer elevated at the time when we collected<br />
errors Total were used to account 11/31 (35) for 6/30 interdependency (20) 3/85 (4) of outcome 4/86 (5)<br />
between twins. Age was used as the underlying time and was<br />
throat swaps and immunological samples. The pathological<br />
thus differences inherently controlled betweenfor the in the two mortality groups analyses. whichTest could for explain<br />
pictures of the dead children were quite different and the<br />
proportionality differences of hazard rates were computed using Schoenfeldt<br />
residuals<br />
deaths the did cluster, between<br />
and<br />
not<br />
by<br />
occur but the thistwo visual<br />
immediately. perhaps groups which<br />
inspection of<br />
Hence, not<br />
the cumulative<br />
itsurprising could explain<br />
is unlikely<br />
risk<br />
that as the mortal<br />
the curves.<br />
Cumulative theity cluster,<br />
children wasbut nothis mortality diedlonger perhaps<br />
of the curves same elevated not surprising<br />
were infection. at the<br />
drawn However, time as the<br />
using the itwhen mortality<br />
was no longer elevated at the time when we collected<br />
Kaplan-Meier may bewe collected<br />
method. speculated throat We swaps that tested the whether and pathogen immunological there weakened were differences the samples. children in the The who age pathologica<br />
throat swaps and immunological samples. The pathological<br />
death died later, in a linear possibly regression by encounter model with on the a new log-transformed pathogen. age.<br />
pictures pictures of the ofdead the children dead children were quite were different quiteand different the and the<br />
When we halted the trial we did not know whether<br />
We<br />
deaths deaths<br />
there tested<br />
did<br />
might interactions<br />
not didoccur not occur immediately. immediately.<br />
be morebetween deaths among baseline<br />
Hence,<br />
children characteristics,<br />
itHence, is unlikely it that is unlikely tha<br />
with whom<br />
season the the children<br />
we hadof children<br />
not enrolment died of died<br />
yet had(rainy theof same<br />
contact. season theinfection. same<br />
However, June infection. to However,<br />
that November, it However, may<br />
was not dry be it may be<br />
the<br />
season case; speculated there December that the<br />
werethat to noMay), pathogen the additional and pathogen admission weakened<br />
early weakened deaths to theneonatal children<br />
among the nursery who<br />
the children who<br />
before died<br />
children died later, enrolment later, possibly<br />
recruited possibly by by<br />
in<br />
Wald encounter<br />
October by test encounter statistics. with a new<br />
and November.<br />
We with analysed pathogen. aThe neweffect<br />
problem<br />
apparently had passed. However, restart<br />
intervention<br />
pathogen.<br />
modification When weby halted investigating the trial the we homogeneity did not know of the whether effect of<br />
When we<br />
might bein more the<br />
halted<br />
different<br />
the<br />
deaths among categories<br />
trial we<br />
children of<br />
did<br />
the with suspected<br />
not know whethe<br />
whom<br />
the trial. Though this may have been due to a pathogen<br />
modifier, wethere had not also might yet by Wald had be contact. test more statistics. deaths However, Effect among that modifiers was children not considered thewith whom<br />
were case; we age there had at and were not place yet noof additional had enrolment, contact. early place However, deaths of residence, among that birth the was not the<br />
weight, Table 4head Causes circumference, of death by MUAC, intervention and maternal and ageMUAC, at death<br />
children recruited in October and November. The problem<br />
apparently had passed. However, we did Deaths not after restart 2<br />
age,<br />
case; there were no additional early deaths among the<br />
parity, schooling, and Deaths socioeconomic within status.<br />
children recruited first 2 months in October andmonths November. of age The prob<br />
the trial. Though this may have been due to a pathogen<br />
lem apparently VAShad passed. OPV However, VAS we OPV did not restar<br />
Resp. the diseases trial. Though 5 this may 1 have been 2 due to 1 a pathogen<br />
Table 4 Causes of death by intervention and age at death<br />
Diarrhoea 2 0 0 0<br />
Deaths within<br />
Deaths after 2<br />
Sepsis Table 4 Causes1 first of2death months0 by intervention 0months of and age1<br />
age at death<br />
Kernicterus VAS 0 OPV 1<br />
Deaths within<br />
VAS 0 OPV 0<br />
Deaths after 2<br />
Chickenpox Resp. diseases 05 first 20 1 months 02 months 1 of age<br />
Unknown* Diarrhoea 32 VAS 20 OPV 10 VAS 30<br />
OPV<br />
Total Sepsis<br />
Resp. diseases<br />
11 1<br />
5<br />
40 1<br />
30 61<br />
2 1<br />
Kernicterus *Three families moved before 0 autopsy, and1 a diagnosis could 0 not be 0<br />
established Diarrhoea in six children. 2 0 0<br />
Chickenpox 0 0 0 1<br />
0<br />
Unknown* Sepsis 3 1 2 0 1 03<br />
1<br />
Total Kernicterus 11 0 4 1 3 06<br />
0<br />
*Three Chickenpox families moved before autopsy, 0 and a diagnosis 0could not be<br />
established in six children.<br />
0 1<br />
Unknown* 3 2 1 3<br />
neonatal 4 <strong>INTENSIVE</strong> <strong>CARE</strong> Vol. 29 No. 4 Fall 2016 Total neonatal <strong>INTENSIVE</strong> 11 <strong>CARE</strong> 4 Vol. XX No. X 3Xxxx XXXX 47 6<br />
• •<br />
*Three families moved before autopsy, and a diagnosis could not be