

GENERAL MOTORS
GM%20Strategic%20and%20Operational%20Overview_
GM%20Strategic%20and%20Operational%20Overview_

You also want an ePaper? Increase the reach of your titles
YUMPU automatically turns print PDFs into web optimized ePapers that Google loves.
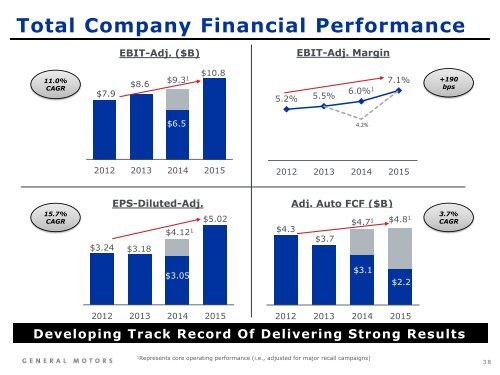
Total Company Financial Performance<br />
EBIT-Adj. ($B)<br />
EBIT-Adj. Margin<br />
11.0%<br />
CAGR<br />
$7.9<br />
$8.6<br />
$9.3 1<br />
$10.8<br />
5.2% 5.5% 6.0%1 7.1%<br />
+190<br />
bps<br />
$6.5<br />
4.2%<br />
2012 2013 2014 2015<br />
2012 2013 2014 2015<br />
15.7%<br />
CAGR<br />
EPS-Diluted-Adj.<br />
$5.02<br />
$4.12 1 $4.3 $3.7<br />
Adj. Auto FCF ($B)<br />
$4.7 1<br />
$4.8 1<br />
3.7%<br />
CAGR<br />
$3.24 $3.18<br />
$3.05<br />
$3.1<br />
$2.2<br />
2012 2013 2014 2015<br />
2012 2013 2014 2015<br />
Developing Track Record Of Delivering Strong Results<br />
1<br />
Represents core operating performance (i.e., adjusted for major recall campaigns)<br />
38