

Bangladesh 2014
8ln3LMTjp
8ln3LMTjp

Create successful ePaper yourself
Turn your PDF publications into a flip-book with our unique Google optimized e-Paper software.
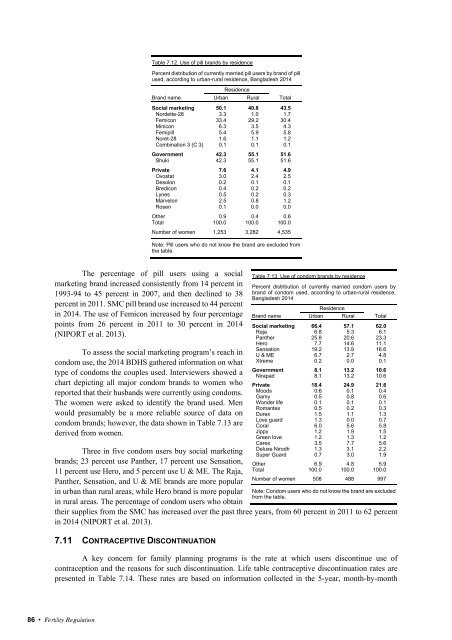
Table 7.12 Use of pill brands by residence<br />
Percent distribution of currently married pill users by brand of pill<br />
used, according to urban-rural residence, <strong>Bangladesh</strong> <strong>2014</strong><br />
Brand name<br />
Urban<br />
Residence<br />
Rural<br />
Total<br />
Social marketing 50.1 40.8 43.5<br />
Nordette-28 3.3 1.0 1.7<br />
Femicon 33.4 29.2 30.4<br />
Minicon 6.3 3.5 4.3<br />
Femipill 5.4 5.9 5.8<br />
Noret-28 1.6 1.1 1.2<br />
Combination 3 (C 3) 0.1 0.1 0.1<br />
Government 42.3 55.1 51.6<br />
Shuki 42.3 55.1 51.6<br />
Private 7.6 4.1 4.9<br />
Ovostat 3.0 2.4 2.5<br />
Desolon 0.2 0.1 0.1<br />
Bredicon 0.4 0.2 0.2<br />
Lynes 0.5 0.2 0.3<br />
Marvelon 2.5 0.8 1.2<br />
Rosen 0.1 0.0 0.0<br />
Other 0.9 0.4 0.6<br />
Total 100.0 100.0 100.0<br />
Number of women 1,253 3,282 4,535<br />
Note: Pill users who do not know the brand are excluded from<br />
the table.<br />
The percentage of pill users using a social<br />
marketing brand increased consistently from 14 percent in<br />
1993-94 to 45 percent in 2007, and then declined to 38<br />
percent in 2011. SMC pill brand use increased to 44 percent<br />
in <strong>2014</strong>. The use of Femicon increased by four percentage<br />
points from 26 percent in 2011 to 30 percent in <strong>2014</strong><br />
(NIPORT et al. 2013).<br />
To assess the social marketing program’s reach in<br />
condom use, the <strong>2014</strong> BDHS gathered information on what<br />
type of condoms the couples used. Interviewers showed a<br />
chart depicting all major condom brands to women who<br />
reported that their husbands were currently using condoms.<br />
The women were asked to identify the brand used. Men<br />
would presumably be a more reliable source of data on<br />
condom brands; however, the data shown in Table 7.13 are<br />
derived from women.<br />
Three in five condom users buy social marketing<br />
brands; 23 percent use Panther, 17 percent use Sensation,<br />
11 percent use Hero, and 5 percent use U & ME. The Raja,<br />
Panther, Sensation, and U & ME brands are more popular<br />
in urban than rural areas, while Hero brand is more popular<br />
in rural areas. The percentage of condom users who obtain<br />
their supplies from the SMC has increased over the past three years, from 60 percent in 2011 to 62 percent<br />
in <strong>2014</strong> (NIPORT et al. 2013).<br />
7.11 CONTRACEPTIVE DISCONTINUATION<br />
Table 7.13 Use of condom brands by residence<br />
Percent distribution of currently married condom users by<br />
brand of condom used, according to urban-rural residence,<br />
<strong>Bangladesh</strong> <strong>2014</strong><br />
Brand name<br />
Residence<br />
Urban Rural<br />
A key concern for family planning programs is the rate at which users discontinue use of<br />
contraception and the reasons for such discontinuation. Life table contraceptive discontinuation rates are<br />
presented in Table 7.14. These rates are based on information collected in the 5-year, month-by-month<br />
Total<br />
Social marketing 66.4 57.1 62.0<br />
Raja 6.8 5.3 6.1<br />
Panther 25.8 20.6 23.3<br />
Hero 7.7 14.6 11.1<br />
Sensation 19.2 13.9 16.6<br />
U & ME 6.7 2.7 4.8<br />
Xtreme 0.2 0.0 0.1<br />
Government 8.1 13.2 10.6<br />
Nirapad 8.1 13.2 10.6<br />
Private 18.4 24.9 21.6<br />
Moods 0.6 0.1 0.4<br />
Gamy 0.5 0.8 0.6<br />
Wonder life 0.1 0.1 0.1<br />
Romantex 0.5 0.2 0.3<br />
Durex 1.5 1.1 1.3<br />
Love guard 1.3 0.0 0.7<br />
Coral 6.0 5.6 5.8<br />
Jippy 1.2 1.9 1.5<br />
Green love 1.2 1.3 1.2<br />
Carex 3.5 7.7 5.6<br />
Deluxe Nirodh 1.3 3.1 2.2<br />
Super Guard 0.7 3.0 1.9<br />
Other 6.9 4.8 5.9<br />
Total 100.0 100.0 100.0<br />
Number of women 508 488 997<br />
Note: Condom users who do not know the brand are excluded<br />
from the table.<br />
86 • Fertility Regulation