
Create successful ePaper yourself
Turn your PDF publications into a flip-book with our unique Google optimized e-Paper software.
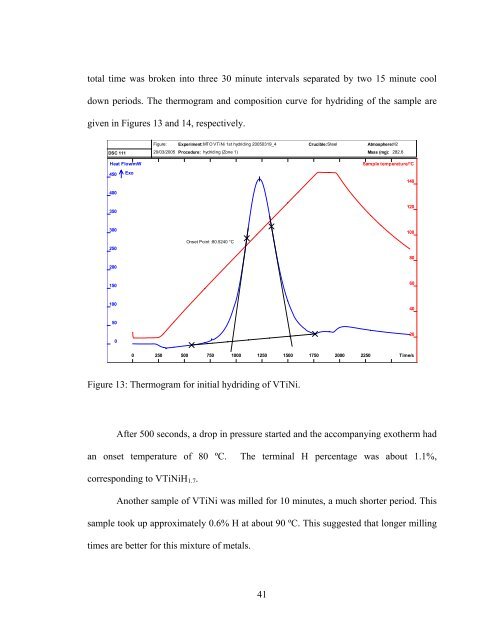
total time was broken into three 30 minute intervals separated by two 15 minute cool<br />
down periods. The thermogram and composition curve for hydriding of the sample are<br />
given in Figures 13 and 14, respectively.<br />
DSC 111<br />
Heat Flow/mW<br />
450 Exo<br />
Figure: Experiment:MTO VTiNi 1st hydriding 20050319_4<br />
Crucible:Steel<br />
Atmosphere:H2<br />
20/03/2005 Procedure: hydriding (Zone 1)<br />
Mass (mg): 282.6<br />
Sample temperature/°C<br />
140<br />
400<br />
350<br />
120<br />
300<br />
250<br />
200<br />
Onset Point :80.5240 °C<br />
100<br />
80<br />
150<br />
60<br />
100<br />
40<br />
50<br />
0<br />
20<br />
0 250 500 750 1000 1250 1500 1750 2000 2250<br />
Time/s<br />
Figure 13: Thermogram for initial hydriding of VTiNi.<br />
After 500 seconds, a drop in pressure started and the accompanying exotherm had<br />
an onset temperature of 80 ºC. The terminal H percentage was about 1.1%,<br />
corresponding to VTiNiH 1.7 .<br />
Another sample of VTiNi was milled for 10 minutes, a much shorter period. This<br />
sample took up approximately 0.6% H at about 90 ºC. This suggested that longer milling<br />
times are better for this mixture of metals.<br />
41