
Create successful ePaper yourself
Turn your PDF publications into a flip-book with our unique Google optimized e-Paper software.
MAGYAR NEMZETI BANK<br />
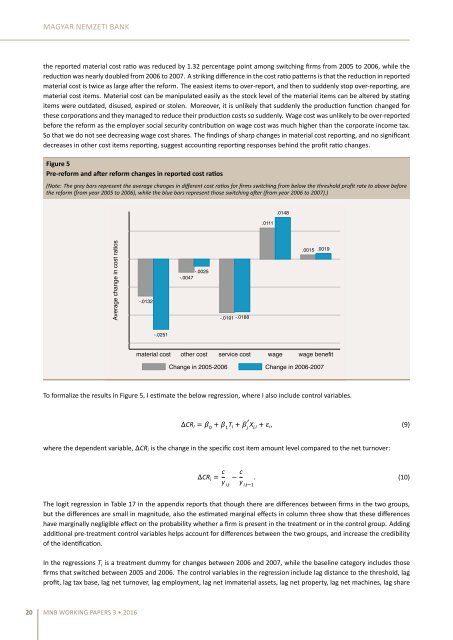
the reported material cost rao was reduced by 1.32 percentage point among switching firms <strong>from</strong> 2005 to 2006, while the<br />
reducon was nearly doubled <strong>from</strong> 2006 to 2007. A striking difference in the cost rao paerns is that the reducon in reported<br />
material cost is twice as large aer the reform. The easiest items to over-report, and then to suddenly stop over-reporng, are<br />
material cost items. Material cost can be manipulated easily as the stock level of the material items can be altered by stang<br />
items were outdated, disused, expired or stolen. Moreover, it is unlikely that suddenly the producon funcon changed for<br />
these corporaons and they managed to reduce their producon costs so suddenly. Wage cost was unlikely to be over-reported<br />
before the reform as the employer social security contribuon on wage cost was much higher than the corporate income tax.<br />
So that we do not see decreasing wage cost shares. The findings of sharp changes in material cost reporng, and no significant<br />
decreases in other cost items reporng, suggest accounng reporng responses behind the profit rao changes.<br />
Figure 5<br />
Pre-reform and aer reform changes in reported cost raos<br />
(Note: The grey bars represent the average changes in different cost raos for firms switching <strong>from</strong> below the threshold profit rate to above before<br />
the reform (<strong>from</strong> year 2005 to 2006), while the blue bars represent those switching aer (<strong>from</strong> year 2006 to 2007).)<br />
.0111<br />
.0148<br />
Average change in cost ratios<br />
-.03 -.02 -.01 0 .01<br />
-.0132<br />
-.0251<br />
-.0025<br />
-.0047<br />
-.0191 -.0188<br />
.0015 .0019<br />
material cost other cost service cost wage wage benefit<br />
Change in 2005-2006 Change in 2006-2007<br />
To formalize the results in Figure 5, I esmate the below regression, where I also include control variables.<br />
CR i 0<br />
1<br />
T i j X j,i i , (9)<br />
where the dependent variable, CR i is the change in the specific cost item amount level compared to the net turnover:<br />
CR i c y i,t<br />
c y i,t1<br />
. (10)<br />
The logit regression in Table 17 in the appendix reports that though there are differences between firms in the two groups,<br />
but the differences are small in magnitude, also the esmated marginal effects in column three show that these differences<br />
have marginally negligible effect on the probability whether a firm is present in the treatment or in the control group. Adding<br />
addional pre-treatment control variables helps account for differences between the two groups, and increase the credibility<br />
of the idenficaon.<br />
In the regressions T i is a treatment dummy for changes between 2006 and 2007, while the baseline category includes those<br />
firms that switched between 2005 and 2006. The control variables in the regression include lag distance to the threshold, lag<br />
profit, lag tax base, lag net turnover, lag employment, lag net immaterial assets, lag net property, lag net machines, lag share<br />
20 MNB WORKING PAPERS 3 • 2016