
Create successful ePaper yourself
Turn your PDF publications into a flip-book with our unique Google optimized e-Paper software.
MAGYAR NEMZETI BANK<br />
Table 4<br />
Changes in reported cost structure for different years<br />
Dep. varbs.<br />
02/03<br />
-03/04<br />
Changes in material cost per turnover rao<br />
03/04<br />
-04/05<br />
04/05<br />
-05/06<br />
05/06<br />
-06/07<br />
06/07<br />
-07/08<br />
T i 1 0.002 -0.009** 0.004 -0.0124*** 0.01***<br />
(0.004) (0.004) (0.003) (0.003) (0.003)<br />
Constant -0.012 -0.005 -0.013** -0.0151*** -0.033***<br />
(0.007) (0.006) (0.006) (0.005) (0.005)<br />
Controls X X X X X<br />
N 5 978 8 175 11 352 15 548 14 795<br />
Note: The control variables include lag distance to the threshold, lag profit, lag total turnover, lag net turnover, lag employment, lag assets, lag share<br />
capital, age and age square. Standard errors are shown in parentheses and stars indicate stascal significance level. * = 10% level, ** = 5% level,<br />
*** = 1% level.<br />
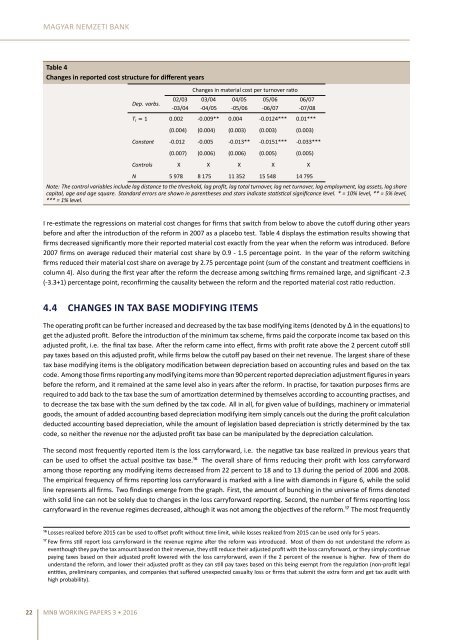
I re-esmate the regressions on material cost changes for firms that switch <strong>from</strong> below to above the cutoff during other years<br />
before and aer the introducon of the reform in 2007 as a placebo test. Table 4 displays the esmaon results showing that<br />
firms decreased significantly more their reported material cost exactly <strong>from</strong> the year when the reform was introduced. Before<br />
2007 firms on average reduced their material cost share by 0.9 - 1.5 percentage point. In the year of the reform switching<br />
firms reduced their material cost share on average by 2.75 percentage point (sum of the constant and treatment coefficiens in<br />
column 4). Also during the first year aer the reform the decrease among switching firms remained large, and significant -2.3<br />
(-3.3+1) percentage point, reconfirming the causality between the reform and the reported material cost rao reducon.<br />
4.4 CHANGES IN TAX BASE MODIFYING ITEMS<br />
The operang profit can be further increased and decreased by the tax base modifying items (denoted by in the equaons) to<br />
get the adjusted profit. Before the introducon of the minimum tax scheme, firms paid the corporate income tax based on this<br />
adjusted profit, i.e. the final tax base. Aer the reform came into effect, firms with profit rate above the 2 percent cutoff sll<br />
pay taxes based on this adjusted profit, while firms below the cutoff pay based on their net revenue. The largest share of these<br />
tax base modifying items is the obligatory modificaon between depreciaon based on accounng rules and based on the tax<br />
code. Among those firms reporng any modifying items more than 90 percent reported depreciaon adjustment figures in years<br />
before the reform, and it remained at the same level also in years aer the reform. In pracse, for taxaon purposes firms are<br />
required to add back to the tax base the sum of amorzaon determined by themselves according to accounng pracses, and<br />
to decrease the tax base with the sum defined by the tax code. All in all, for given value of buildings, machinery or immaterial<br />
goods, the amount of added accounng based depreciaon modifying item simply cancels out the during the profit calculaon<br />
deducted accounng based depreciaon, while the amount of legislaon based depreciaon is strictly determined by the tax<br />
code, so neither the revenue nor the adjusted profit tax base can be manipulated by the depreciaon calculaon.<br />
The second most frequently reported item is the loss carryforward, i.e. the negave tax base realized in previous years that<br />
can be used to offset the actual posive tax base.¹⁶ The overall share of firms reducing their profit with loss carryforward<br />
among those reporng any modifying items decreased <strong>from</strong> 22 percent to 18 and to 13 during the period of 2006 and 2008.<br />
The empirical frequency of firms reporng loss carryforward is marked with a line with diamonds in Figure 6, while the solid<br />
line represents all firms. Two findings emerge <strong>from</strong> the graph. First, the amount of <strong>bunching</strong> in the universe of firms denoted<br />
with solid line can not be solely due to changes in the loss carryforward reporng. Second, the number of firms reporng loss<br />
carryforward in the revenue regimes decreased, although it was not among the objecves of the reform.¹⁷ The most frequently<br />
¹⁶ Losses realized before 2015 can be used to offset profit without me limit, while losses realized <strong>from</strong> 2015 can be used only for 5 years.<br />
¹⁷ Few firms sll report loss carryforward in the revenue regime aer the reform was introduced. Most of them do not understand the reform as<br />
eventhough they pay the tax amount based on their revenue, they sll reduce their adjusted profit with the loss carryforward, or they simply connue<br />
paying taxes based on their adjusted profit lowered with the loss carryforward, even if the 2 percent of the revenue is higher. Few of them do<br />
understand the reform, and lower their adjusted profit as they can sll pay taxes based on this being exempt <strong>from</strong> the regulaon (non-profit legal<br />
enes, preliminary companies, and companies that suffered unexpected casualty loss or firms that submit the extra form and get tax audit with<br />
high probability).<br />
22 MNB WORKING PAPERS 3 • 2016