
Create successful ePaper yourself
Turn your PDF publications into a flip-book with our unique Google optimized e-Paper software.
APPENDIX<br />
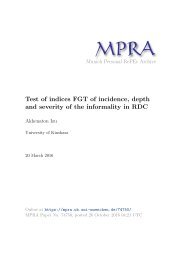
Figure 17<br />
All firms, and firms reporng tax base decreasing item of “investment subsidy for small and medium size enterprises”<br />
(Notes: The figure presents the empirical frequency of firms based on their profit rate for fiscal year 2007. The counterfactual is the last fiscal year<br />
before the introducon of the minimum tax scheme (2006). The bin width is 0.0016. The 2 percent profit threshold is marked by a vercal dashed<br />
line; the 0 profit rate is marked by a vercal solid line. The solid line represents all firms in the profit rate range on the horizontal axis, while the<br />
doed line represents firms with reporng tax base increasing item of “investment subsidy for small and medium size enterprises”.)<br />
Number of companies<br />
0 2000 4000<br />
-.02 0 .02 .04 .06 .08 .1<br />
Profit ratio<br />
Pre-reform (2006) After reform (2007)<br />
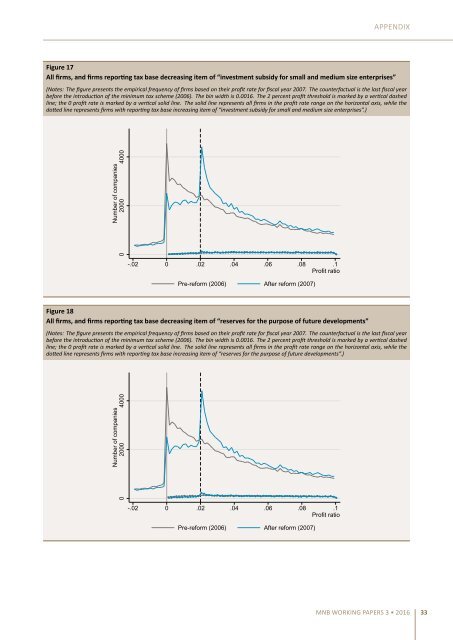
Figure 18<br />
All firms, and firms reporng tax base decreasing item of “reserves for the purpose of future developments”<br />
(Notes: The figure presents the empirical frequency of firms based on their profit rate for fiscal year 2007. The counterfactual is the last fiscal year<br />
before the introducon of the minimum tax scheme (2006). The bin width is 0.0016. The 2 percent profit threshold is marked by a vercal dashed<br />
line; the 0 profit rate is marked by a vercal solid line. The solid line represents all firms in the profit rate range on the horizontal axis, while the<br />
doed line represents firms with reporng tax base increasing item of “reserves for the purpose of future developments”.)<br />
Number of companies<br />
0 2000 4000<br />
-.02 0 .02 .04 .06 .08 .1<br />
Profit ratio<br />
Pre-reform (2006) After reform (2007)<br />
MNB WORKING PAPERS 3 • 2016 33