
You also want an ePaper? Increase the reach of your titles
YUMPU automatically turns print PDFs into web optimized ePapers that Google loves.
APPENDIX<br />
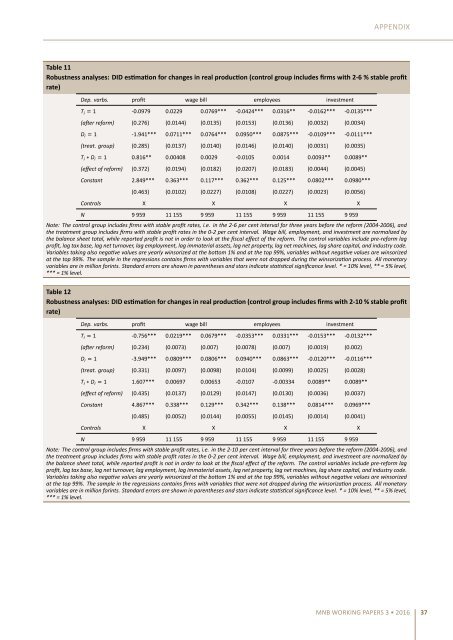
Table 11<br />
Robustness analyses: DID esmaon for changes in real producon (control group includes firms with 2-6 % stable profit<br />
rate)<br />
Dep. varbs. profit wage bill employees investment<br />
T i 1 -0.0979 0.0229 0.0769*** -0.0424*** 0.0316** -0.0162*** -0.0135***<br />
(aer reform) (0.276) (0.0144) (0.0135) (0.0153) (0.0136) (0.0032) (0.0034)<br />
D i 1 -1.941*** 0.0711*** 0.0764*** 0.0950*** 0.0875*** -0.0109*** -0.0111***<br />
(treat. group) (0.285) (0.0137) (0.0140) (0.0146) (0.0140) (0.0031) (0.0035)<br />
T i ∗ D i 1 0.816** 0.00408 0.0029 -0.0105 0.0014 0.0093** 0.0089**<br />
(effect of reform) (0.372) (0.0194) (0.0182) (0.0207) (0.0183) (0.0044) (0.0045)<br />
Constant 2.849*** 0.363*** 0.117*** 0.362*** 0.125*** 0.0802*** 0.0980***<br />
(0.463) (0.0102) (0.0227) (0.0108) (0.0227) (0.0023) (0.0056)<br />
Controls X X X X<br />
N 9 959 11 155 9 959 11 155 9 959 11 155 9 959<br />
Note: The control group includes firms with stable profit rates, i.e. in the 2-6 per cent interval for three years before the reform (2004-2006), and<br />
the treatment group includes firms with stable profit rates in the 0-2 per cent interval. Wage bill, employment, and investment are normalized by<br />
the balance sheet total, while reported profit is not in order to look at the fiscal effect of the reform. The control variables include pre-reform lag<br />
profit, lag tax base, lag net turnover, lag employment, lag immaterial assets, lag net property, lag net machines, lag share capital, and industry code.<br />
Variables taking also negave values are yearly winsorized at the boom 1% and at the top 99%, variables without negave values are winsorized<br />
at the top 99%. The sample in the regressions contains firms with variables that were not dropped during the winsorizaon process. All monetary<br />
variables are in million forints. Standard errors are shown in parentheses and stars indicate stascal significance level. * = 10% level, ** = 5% level,<br />
*** = 1% level.<br />
Table 12<br />
Robustness analyses: DID esmaon for changes in real producon (control group includes firms with 2-10 % stable profit<br />
rate)<br />
Dep. varbs. profit wage bill employees investment<br />
T i 1 -0.756*** 0.0219*** 0.0679*** -0.0353*** 0.0331*** -0.0153*** -0.0132***<br />
(aer reform) (0.234) (0.0073) (0.007) (0.0078) (0.007) (0.0019) (0.002)<br />
D i 1 -3.949*** 0.0809*** 0.0806*** 0.0940*** 0.0863*** -0.0120*** -0.0116***<br />
(treat. group) (0.331) (0.0097) (0.0098) (0.0104) (0.0099) (0.0025) (0.0028)<br />
T i ∗ D i 1 1.607*** 0.00697 0.00653 -0.0107 -0.00334 0.0089** 0.0089**<br />
(effect of reform) (0.435) (0.0137) (0.0129) (0.0147) (0.0130) (0.0036) (0.0037)<br />
Constant 4.867*** 0.338*** 0.129*** 0.342*** 0.138*** 0.0814*** 0.0969***<br />
(0.485) (0.0052) (0.0144) (0.0055) (0.0145) (0.0014) (0.0041)<br />
Controls X X X X<br />
N 9 959 11 155 9 959 11 155 9 959 11 155 9 959<br />
Note: The control group includes firms with stable profit rates, i.e. in the 2-10 per cent interval for three years before the reform (2004-2006), and<br />
the treatment group includes firms with stable profit rates in the 0-2 per cent interval. Wage bill, employment, and investment are normalized by<br />
the balance sheet total, while reported profit is not in order to look at the fiscal effect of the reform. The control variables include pre-reform lag<br />
profit, lag tax base, lag net turnover, lag employment, lag immaterial assets, lag net property, lag net machines, lag share capital, and industry code.<br />
Variables taking also negave values are yearly winsorized at the boom 1% and at the top 99%, variables without negave values are winsorized<br />
at the top 99%. The sample in the regressions contains firms with variables that were not dropped during the winsorizaon process. All monetary<br />
variables are in million forints. Standard errors are shown in parentheses and stars indicate stascal significance level. * = 10% level, ** = 5% level,<br />
*** = 1% level.<br />
MNB WORKING PAPERS 3 • 2016 37