
You also want an ePaper? Increase the reach of your titles
YUMPU automatically turns print PDFs into web optimized ePapers that Google loves.
EVIDENCE FOR ACCOUNTING RATHER THAN REAL RESPONSES<br />
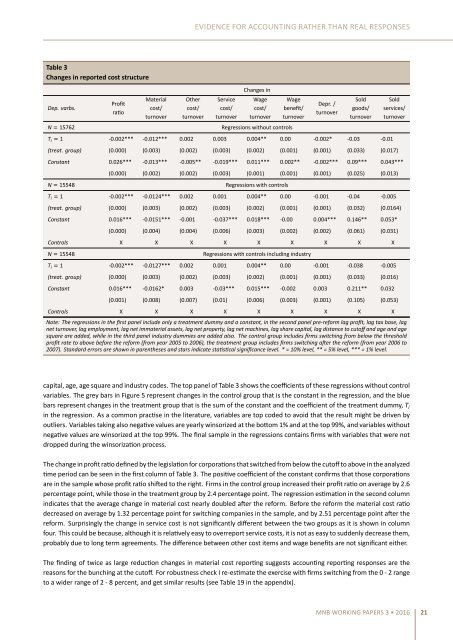
Table 3<br />
Changes in reported cost structure<br />
Dep. varbs.<br />
N 15762<br />
Profit<br />
rao<br />
Material<br />
cost/<br />
turnover<br />
Other<br />
cost/<br />
turnover<br />
Service<br />
cost/<br />
turnover<br />
Changes in<br />
Wage<br />
cost/<br />
turnover<br />
Regressions without controls<br />
Wage<br />
benefit/<br />
turnover<br />
Depr. /<br />
turnover<br />
Sold<br />
goods/<br />
turnover<br />
T i 1 -0.002*** -0.012*** 0.002 0.003 0.004** 0.00 -0.002* -0.03 -0.01<br />
(treat. group) (0.000) (0.003) (0.002) (0.003) (0.002) (0.001) (0.001) (0.033) (0.017)<br />
Sold<br />
services/<br />
turnover<br />
Constant 0.026*** -0.013*** -0.005** -0.019*** 0.011*** 0.002** -0.002*** 0.09*** 0.043***<br />
N 15548<br />
(0.000) (0.002) (0.002) (0.003) (0.001) (0.001) (0.001) (0.025) (0.013)<br />
Regressions with controls<br />
T i 1 -0.002*** -0.0124*** 0.002 0.001 0.004** 0.00 -0.001 -0.04 -0.005<br />
(treat. group) (0.000) (0.003) (0.002) (0.003) (0.002) (0.001) (0.001) (0.032) (0.0164)<br />
Constant 0.016*** -0.0151*** -0.001 -0.037*** 0.018*** -0.00 0.004*** 0.146** 0.053*<br />
(0.000) (0.004) (0.004) (0.006) (0.003) (0.002) (0.002) (0.061) (0.031)<br />
Controls X X X X X X X X X<br />
N 15548<br />
Regressions with controls including industry<br />
T i 1 -0.002*** -0.0127*** 0.002 0.001 0.004** 0.00 -0.001 -0.038 -0.005<br />
(treat. group) (0.000) (0.003) (0.002) (0.003) (0.002) (0.001) (0.001) (0.033) (0.016)<br />
Constant 0.016*** -0.0162* 0.003 -0.03*** 0.015*** -0.002 0.003 0.211** 0.032<br />
(0.001) (0.008) (0.007) (0.01) (0.006) (0.003) (0.001) (0.105) (0.053)<br />
Controls X X X X X X X X X<br />
Note: The regressions in the first panel include only a treatment dummy and a constant, in the second panel pre-reform lag profit, lag tax base, lag<br />
net turnover, lag employment, lag net immaterial assets, lag net property, lag net machines, lag share capital, lag distance to cutoff and age and age<br />
square are added, while in the third panel industry dummies are added also. The control group includes firms switching <strong>from</strong> below the threshold<br />
profit rate to above before the reform (<strong>from</strong> year 2005 to 2006), the treatment group includes firms switching aer the reform (<strong>from</strong> year 2006 to<br />
2007). Standard errors are shown in parentheses and stars indicate stascal significance level. * = 10% level, ** = 5% level, *** = 1% level.<br />
capital, age, age square and industry codes. The top panel of Table 3 shows the coefficients of these regressions without control<br />
variables. The grey bars in Figure 5 represent changes in the control group that is the constant in the regression, and the blue<br />
bars represent changes in the treatment group that is the sum of the constant and the coefficient of the treatment dummy, T i<br />
in the regression. As a common pracse in the literature, variables are top coded to avoid that the result might be driven by<br />
outliers. Variables taking also negave values are yearly winsorized at the boom 1% and at the top 99%, and variables without<br />
negave values are winsorized at the top 99%. The final sample in the regressions contains firms with variables that were not<br />
dropped during the winsorizaon process.<br />
The change in profit rao defined by the legislaon for corporaons that switched <strong>from</strong> below the cutoff to above in the analyzed<br />
me period can be seen in the first column of Table 3. The posive coefficient of the constant confirms that those corporaons<br />
are in the sample whose profit rao shied to the right. Firms in the control group increased their profit rao on average by 2.6<br />
percentage point, while those in the treatment group by 2.4 percentage point. The regression esmaon in the second column<br />
indicates that the average change in material cost nearly doubled aer the reform. Before the reform the material cost rao<br />
decreased on average by 1.32 percentage point for switching companies in the sample, and by 2.51 percentage point aer the<br />
reform. Surprisingly the change in service cost is not significantly different between the two groups as it is shown in column<br />
four. This could be because, although it is relavely easy to overreport service costs, it is not as easy to suddenly decrease them,<br />
probably due to long term agreements. The difference between other cost items and wage benefits are not significant either.<br />
The finding of twice as large reducon changes in material cost reporng suggests accounng reporng responses are the<br />
reasons for the <strong>bunching</strong> at the cutoff. For robustness check I re-esmate the exercise with firms switching <strong>from</strong> the 0 - 2 range<br />
to a wider range of 2 - 8 percent, and get similar results (see Table 19 in the appendix).<br />
MNB WORKING PAPERS 3 • 2016 21