
You also want an ePaper? Increase the reach of your titles
YUMPU automatically turns print PDFs into web optimized ePapers that Google loves.
MAGYAR NEMZETI BANK<br />
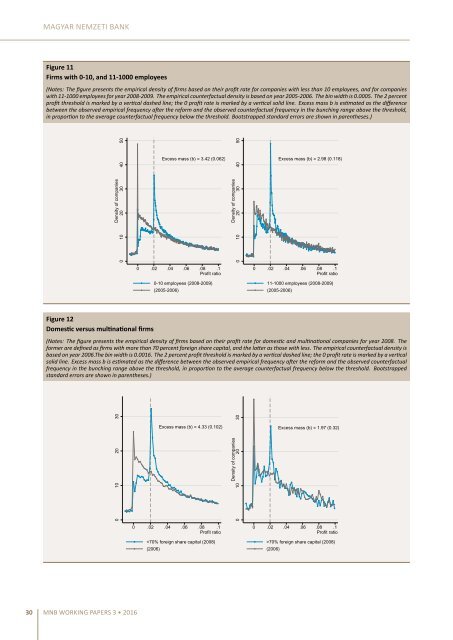
Figure 11<br />
Firms with 0-10, and 11-1000 employees<br />
(Notes: The figure presents the empirical density of firms based on their profit rate for companies with less than 10 employees, and for companies<br />
with 11-1000 employees for year 2008-2009. The empirical counterfactual density is based on year 2005-2006. The bin width is 0.0005. The 2 percent<br />
profit threshold is marked by a vercal dashed line; the 0 profit rate is marked by a vercal solid line. Excess mass b is esmated as the difference<br />
between the observed empirical frequency aer the reform and the observed counterfactual frequency in the <strong>bunching</strong> range above the threshold,<br />
in proporon to the average counterfactual frequency below the threshold. Bootstrapped standard errors are shown in parentheses.)<br />
Density of companies<br />
0 10 20 30 40 50<br />
Excess mass (b) = 3.42 (0.062)<br />
Density of companies<br />
0 10 20 30 40 50<br />
Excess mass (b) = 2.98 (0.118)<br />
0 .02 .04 .06 .08 .1<br />
Profit ratio<br />
0 .02 .04 .06 .08 .1<br />
Profit ratio<br />
0-10 employees (2008-2009)<br />
(2005-2006)<br />
11-1000 employees (2008-2009)<br />
(2005-2006)<br />
Figure 12<br />
Domesc versus mulnaonal firms<br />
(Notes: The figure presents the empirical density of firms based on their profit rate for domesc and mulnaonal companies for year 2008. The<br />
former are defined as firms with more than 70 percent foreign share capital, and the laer as those with less. The empirical counterfactual density is<br />
based on year 2006.The bin width is 0.0016. The 2 percent profit threshold is marked by a vercal dashed line; the 0 profit rate is marked by a vercal<br />
solid line. Excess mass b is esmated as the difference between the observed empirical frequency aer the reform and the observed counterfactual<br />
frequency in the <strong>bunching</strong> range above the threshold, in proporon to the average counterfactual frequency below the threshold. Bootstrapped<br />
standard errors are shown in parentheses.)<br />
0 10 20 30<br />
Excess mass (b) = 4.33 (0.102)<br />
Density of companies<br />
0 10 20 30<br />
Excess mass (b) = 1.97 (0.32)<br />
0 .02 .04 .06 .08 .1<br />
Profit ratio<br />
0 .02 .04 .06 .08 .1<br />
Profit ratio<br />
70% foreign share capital (2008)<br />
(2006)<br />
30 MNB WORKING PAPERS 3 • 2016