- Page 1 and 2:
JavaScript 2.0-The Complete Referen
- Page 3 and 4:
JavaScript 2.0-The Complete Referen
- Page 5 and 6:
Serrato, Darlene Hernandez, Michele
- Page 7 and 8:
First JavaScript document.write("
- Page 9 and 10:
In this case, the tag happens to s
- Page 11 and 12:
Ready start alert("First Script
- Page 13 and 14:
Script Hiding Most browsers tend to
- Page 15 and 16:
alert("Your JavaScript is on!
- Page 17 and 18:
- Page 19 and 20:
Event Trigger Example A re
- Page 21 and 22:
Notice that the src attribu
- Page 23 and 24:
Figure 1-6: JavaScript console used
- Page 25 and 26:
Table 1-1: Browser Versions and Jav
- Page 27 and 28:
A scripting language is a language
- Page 29 and 30:
This is not a problem in itself. Th
- Page 31 and 32:
y a linebreak without causing an er
- Page 33 and 34:
Being weakly typed is both a blessi
- Page 35 and 36:
myArray[1] = 5; myArray[2] = "Thoma
- Page 37 and 38:
To compare objects, JavaScript prov
- Page 39 and 40:
} else { } x = x + 1; First, the co
- Page 41 and 42:
do { document.write(x); document.wr
- Page 43 and 44:
This code declares a function named
- Page 45 and 46:
document.write("This text is no
- Page 47 and 48:
*/ invoke it as follows: var y = sq
- Page 49 and 50:
Part II: Core Language Chapter 3: D
- Page 51 and 52:
throughout both the chapter and the
- Page 53 and 54:
The other important special value i
- Page 55 and 56:
Things get really messy if you work
- Page 57 and 58:
Close examination of the table of e
- Page 59 and 60:
document.write("Note how newlines (
- Page 61 and 62:
Note Some Netscape browsers do not
- Page 63 and 64:
Methods of objects are accessed in
- Page 65 and 66:
The typeof Operator If you‘re cur
- Page 67 and 68:
Number "NaN", "0", or the string re
- Page 69 and 70:
A variable‘s name should give som
- Page 71 and 72:
execute. This context contains the
- Page 73 and 74:
} function innerFunction() { } aler
- Page 75 and 76:
context, the interpreter would firs
- Page 77 and 78:
y = y - 1 is fine. But if you make
- Page 79 and 80:
Operators JavaScript supports a var
- Page 81 and 82:
There is one further wrinkle with t
- Page 83 and 84:
Table 4-3 shows the bitwise operato
- Page 85 and 86:
Table 4-5: Shorthand Assignment wit
- Page 87 and 88:
Comparison Operators A comparison e
- Page 89 and 90:
"thomas" >> "fritz" "aaaa" >> "a" "
- Page 91 and 92:
var a,b,c,d; a = (b=5, c=7, d=56);
- Page 93 and 94:
alert(myArray[2]); alert(myArray[3]
- Page 95 and 96:
Table 4-9: Precedence and Associati
- Page 97 and 98:
JavaScript supports a core set of s
- Page 99 and 100:
else if (expression2) statement or
- Page 101 and 102:
Figure 4-1: Logical expressions can
- Page 103 and 104:
else if (yourGrade == 'D') alert("N
- Page 105 and 106:
} case 'C': alert("You passed!"); c
- Page 107 and 108:
{ } // do something Last, an import
- Page 109 and 110:
document.write("Start the countdown
- Page 111 and 112:
} document.write("Outerloop: "+i+""
- Page 113 and 114:
The with statement indicates an obj
- Page 115 and 116:
alter program flow. A variety of lo
- Page 117 and 118:
Functions do not have to receive on
- Page 119 and 120:
Functions always return some form o
- Page 121 and 122:
document.write("In function fiddle
- Page 123 and 124:
} x = 7; document.write("x="+x+"");
- Page 125 and 126:
However, more likely, we purposeful
- Page 127 and 128:
document.write("Entering testFuncti
- Page 129 and 130:
"statements for function body"); As
- Page 131 and 132:
A similar kind of nameless function
- Page 133 and 134:
The result shown next demonstrates
- Page 135 and 136:
Note that this isn‘t a terribly r
- Page 137 and 138:
Using Functions Before concluding t
- Page 139 and 140:
} if (addTwo.arguments.length == 2)
- Page 141 and 142:
familiar to anyone who has programm
- Page 143 and 144:
creates String objects while the Ar
- Page 145 and 146:
The result is As you can see, the s
- Page 147 and 148:
Figure 6-1: Enumerating properties
- Page 149 and 150:
statement; Using with lets you refe
- Page 151 and 152:
Declare a function taking two argum
- Page 153 and 154:
Table 6-2: Properties and Methods C
- Page 155 and 156:
Notice that we named the method att
- Page 157 and 158:
If the way the robot object has bee
- Page 159 and 160:
Object-Oriented JavaScript Before j
- Page 161 and 162:
} this.hasJetpack = true; This exam
- Page 163 and 164:
function Robot(flying, action) { }
- Page 165 and 166:
var feature = guard.feature; var ca
- Page 167 and 168:
var firstArray = []; var secondArra
- Page 169 and 170:
The effect is as if no element had
- Page 171 and 172:
var myValues = new Array(); myValue
- Page 173 and 174:
stack.pop(); // ["first", 10] Retur
- Page 175 and 176:
Unlike with the push() and shift()
- Page 177 and 178:
It takes a variable number of argum
- Page 179 and 180:
If you want to be more succinct, yo
- Page 181 and 182:
} { } var last = this[this.length-1
- Page 183 and 184:
Table 7-1: Arguments to the Date()
- Page 185 and 186:
document.write("The current date :
- Page 187 and 188:
If you are not sure whether the par
- Page 189 and 190:
Table 7-2: Globally Available Metho
- Page 191 and 192:
Table 7-4: Methods Provided by the
- Page 193 and 194:
var s = new String(); var headline
- Page 195 and 196:
var s = "JavaScript" + " is" + " a"
- Page 197 and 198:
Table 7-6: HTML-Releated String Met
- Page 199 and 200:
This chapter is an introduction to
- Page 201 and 202:
expressions are designed to be very
- Page 203 and 204:
These characters are ^ and $, indic
- Page 205 and 206:
Table 8-2: Regular Expression Escap
- Page 207 and 208:
var pattern = /ab+c/; is read as
- Page 209 and 210:
var pattern = /[0-9]+/; This regula
- Page 211 and 212:
would match ―abcx7d‖ or ―abc_
- Page 213 and 214:
You could use the following regular
- Page 215 and 216:
document.writeln("result.lastIndex
- Page 217 and 218:
} // if we have a match, print info
- Page 219 and 220:
Table 8-7: Static Properties of the
- Page 221 and 222:
var stringwithdelimits = "10 / 3 /
- Page 223 and 224:
Non-capturing Parentheses JavaScrip
- Page 225 and 226:
addresses instead of domain names (
- Page 227 and 228:
1. The core JavaScript language (e.
- Page 229 and 230:
For the sake of brevity, some detai
- Page 231 and 232:
""); document.write("Page Colors");
- Page 233 and 234:
- Page 235 and 236:
Figure 9-4: Some Document propertie
- Page 237 and 238:
using the traditional JavaScript
- Page 239 and 240:
The onclick attribute of the tag
- Page 241 and 242:
{ } var theirname=document.myForm.u
- Page 243 and 244:
Greeting: The previous examp
- Page 245 and 246:
Table 9-4: New Document Properties
- Page 247 and 248:
Netscape 4 Layer Example An example
- Page 249 and 250:
Figure 9-8: Internet Explorer 4 obj
- Page 251 and 252:
finds tag with id or name = myHeadi
- Page 253 and 254:
Table 9-7: Some New Properties for
- Page 255 and 256:
onclick="document.all['heading1'].s
- Page 257 and 258:
style, and content) to a programmin
- Page 259 and 260:
var feature; var version; for (i=0;
- Page 261 and 262:
The most important thing to think a
- Page 263 and 264:
Before moving on, we need to introd
- Page 265 and 266:
Table 10-2: DOM Node Properties DOM
- Page 267 and 268:
currentElement = currentElement.fir
- Page 269 and 270:
DOM Test Heading
- Page 271 and 272:
} } else alert("No parent"); break;
- Page 273 and 274:
onclick="currentElement=document.do
- Page 275 and 276:
Collection Description >document.an
- Page 277 and 278:
the necessary references. Let‘s s
- Page 279 and 280:
} if (node.parentNode) { } //-->> i
- Page 281 and 282:
- Page 283 and 284:
} function doReplace() { } var repl
- Page 285 and 286:
Table 10-5: Text Node Manipulation
- Page 287 and 288:
onclick="temp = textNode.splitText(
- Page 289 and 290:
7
- Page 291 and 292:
- Page 293 and 294:
-->> Simple DOM HTML Editor &n
- Page 295 and 296:
It would be easy enough to mod
- Page 297 and 298:
Table 10-6: CSS Property-to-DOM Pro
- Page 299 and 300:
"http://www.w3.org/TR/xhtml1/DTD/xh
- Page 301 and 302:
Style: normal italic oblique Wei
- Page 303 and 304:
onchange="theElement.style.fontSize
- Page 305 and 306:
Height: Width: &nbs
- Page 307 and 308:
theElement = document.getElementByI
- Page 309 and 310:
This is a paragraph This is a parag
- Page 311 and 312:
override them with local rules. Und
- Page 313 and 314:
} if (styleSheet.cssRules[0]) { } s
- Page 315 and 316:
There are a few things to study car
- Page 317 and 318:
var myWalker = document.createTreeW
- Page 319 and 320:
While the Traversal API is not wide
- Page 321 and 322:
adding content to the document. Bec
- Page 323 and 324:
inner/outer Tester This is a t
- Page 325 and 326:
>
- Page 327 and 328:
Figure 10-6: Using document.all[] a
- Page 329 and 330:
some consistency to the mad world t
- Page 331 and 332:
Table 11-2: Basic Events and Their
- Page 333 and 334:
ondblclick: onfocus: onkeydown:
- Page 335 and 336:
Browsers might support events othe
- Page 337 and 338:
onbeforedeactivate Fires just befor
- Page 339 and 340:
oncut Fires when selected content i
- Page 341 and 342:
ondrop Fires on a valid drop target
- Page 343 and 344:
onpropertychange Fires whenever a p
- Page 345 and 346:
page Non-standard Event Binding in
- Page 347 and 348:
this is to assign handlers after th
- Page 349 and 350:
Table 11-4: Effect of Returning fal
- Page 351 and 352:
- Page 353 and 354:
One major difference between versio
- Page 355 and 356:
if you check your JavaScript consol
- Page 357 and 358:
To set up event capturing, use the
- Page 359 and 360:
keep tabs on what happened to an ev
- Page 361 and 362:
We may be in the gutter, but some o
- Page 363 and 364:
Table 11-9: Behavior of Internet Ex
- Page 365 and 366:
Table 11-9: Behavior of Internet Ex
- Page 367 and 368:
Preventing Bubbling You can stop ev
- Page 369 and 370:
The DOM2 Event model specification
- Page 371 and 372:
document.getElementById('myText').r
- Page 373 and 374:
Alt Key down? Control Key down? M
- Page 375 and 376:
The result of a click is shown in
- Page 377 and 378:
when the user activates the pull-do
- Page 379 and 380:
function killClicks(event) { } even
- Page 381 and 382:
-->> The killClick handler is regi
- Page 384 and 385:
startListen(); //-->> Current Nod
- Page 386 and 387:
Table 11-18 summarizes the major fe
- Page 388 and 389:
Part IV: Using JavaScript Chapter 1
- Page 390 and 391:
window.confirm(string); or simply c
- Page 392 and 393:
value that contains the value enter
- Page 394 and 395:
Opening and Closing Generic Windows
- Page 397 and 398:
in some browsers, while others may
- Page 399 and 400:
Table 12-1: Feature Parameter Value
- Page 401 and 402:
featurestring += "width="+document.
- Page 403 and 404:
Left: (IE) ScreenX: ScreenY: (Ne
- Page 405 and 406:
Figure 12-1: Simple window and its
- Page 407 and 408:
} } //-->> else customAlert("Bor
- Page 409 and 410:
} } myWindow.focus(); // Make the w
- Page 411 and 412:
windowHTML += ""; windowHTML += "An
- Page 413 and 414:
windowname is the name of the windo
- Page 415 and 416:
function moveIt() { if ((window.myW
- Page 417 and 418:
myWindow.moveBy(0,10);" />> X: Y:
- Page 419 and 420:
It is also possible to access parse
- Page 421 and 422:
5,4,3,2,1...BOOM Browser Self-De
- Page 423 and 424:
message = message.substring(1, mess
- Page 425 and 426:
Event Description onafterprint Even
- Page 427 and 428:
parent.frames[0].name would print o
- Page 429 and 430:
" var i = 0; msg += "Window: "+ win
- Page 431 and 432:
Two Frames within the naviga
- Page 433 and 434:
While inline frames seem to be a si
- Page 435 and 436:
window.onload = frameBuster; // -->
- Page 437 and 438:
Variables
- Page 439 and 440:
Back to previous page While Ja
- Page 441 and 442:
"http://www.w3.org/TR/xhtml1/DTD/xh
- Page 443 and 444:
Interested readers are enc
- Page 445 and 446:
Table 13-1: Document Properties Rel
- Page 447 and 448:
Unvisited Link Click to show active
- Page 449 and 450:
Location and Related Properties The
- Page 451 and 452:
str += "but remember the rules of X
- Page 453 and 454:
You also can read the target proper
- Page 456 and 457:
onclick="document.myform.field1.val
- Page 458 and 459:
} str += "border: "+theImage.border
- Page 460 and 461:
(document.all[10]) or by name (docu
- Page 462 and 463:
Table 13-4: Common DOM Properties f
- Page 464 and 465:
All other (
- Page 466 and 467:
Table 13-7: (X)HTML Elements Associ
- Page 468 and 469:
Table 13-7: (X)HTML Elements Associ
- Page 470 and 471:
} } var newText = document.createTe
- Page 472 and 473:
(X)HTML Table Inspector Test T
- Page 474 and 475:
Jet Packs Economy JP-3455E6
- Page 476 and 477:
above below border box hsides vside
- Page 478 and 479:
for (i = 0; i > document.writeln("R
- Page 480 and 481:
onclick="theTable.insertRow(documen
- Page 482 and 483:
} var colNumber = parseFloat(column
- Page 484 and 485:
} var numberRowsInTable = theTable.
- Page 486 and 487:
onclick="doCellModification(documen
- Page 488 and 489:
- Page 490 and 491:
object. As with all document object
- Page 492 and 493:
Just as the Document contains a col
- Page 494 and 495:
} document.write("length: "+length+
- Page 496 and 497:
property. In short, it is most usef
- Page 498 and 499:
Remember that these buttons (i
- Page 500 and 501:
Table 14-5: Properties of the HTMLB
- Page 502 and 503:
- Page 504 and 505:
Closely related to inputs of type "
- Page 506 and 507:
Common Field Properties
- Page 508 and 509:
Of course, the preceding script
- Page 510 and 511:
Checkboxes and radio buttons (―ra
- Page 512 and 513:
Yes: No: Maybe: does not, as it
- Page 514 and 515:
yes: no: maybe: onclick="a
- Page 516 and 517:
-->> Hidden Fields Hidden form f
- Page 518 and 519:
Trainer Friend Cook An HTMLSelectEl
- Page 520 and 521:
} //-->> alert(msg); Option 1 Op
- Page 522 and 523:
cities["Australia"] = ["Sydney", "M
- Page 524 and 525:
Brisbane The previous example il
- Page 526 and 527:
eserved keyword. We‘ll see anothe
- Page 528 and 529:
- Page 530 and 531:
} for (i = 0; i
- Page 532 and 533:
Abstracting Form Validation The pr
- Page 534 and 535:
} if (/[^@]+@[^@]+/.test(s)) return
- Page 536 and 537:
if (!isInteger(s)) return false; va
- Page 538 and 539:
} { } alert("Email may not be empty
- Page 540 and 541:
} } { } case 'notblank': if (isEmpt
- Page 542:
Form Validation via Hidden Fields A
- Page 545 and 546:
} // Check for special characters l
- Page 547 and 548:
A final observation that escapes ma
- Page 549 and 550:
JavaScript can be used to turn disa
- Page 551 and 552:
Figure 14-4: Rendering of dynamic f
- Page 553 and 554:
} } return true; else { } window.st
- Page 555 and 556:
Widgets: @ 1.50 each Gadgets: @
- Page 557 and 558:
calculated fields. Also note that,
- Page 559 and 560:
Figure 15-1: Manipulating Image pro
- Page 561 and 562:
Complete: Height: Hspace: Nam
- Page 563 and 564:
} } } alt.value = i.alt; border.val
- Page 565 and 566:
"http://www.w3.org/TR/xhtml1/DTD/xh
- Page 567 and 568:
"http://www.w3.org/TR/xhtml1/DTD/xh
- Page 569 and 570:
{ } var i = new Image(); i.src = ur
- Page 571 and 572:
The complete working example is sho
- Page 573 and 574:
...Page content here... Give
- Page 575 and 576:
{ } var abouton = new Image(); abou
- Page 577 and 578:
Figure 15-2
- Page 579 and 580:
With CSS, you can go even furthe
- Page 581 and 582:
Absolutely positioned elements not
- Page 583 and 584:
color of the region to orange as se
- Page 585 and 586:
} } return(getElement(layerName, la
- Page 587 and 588:
} /* set the width of layer named l
- Page 589 and 590:
* return the object for the passed
- Page 591 and 592:
* set the x-coordinate of layer nam
- Page 593 and 594:
} else if (opera) else theLayer.sty
- Page 595 and 596:
} { } theLayer.document.write(conte
- Page 597 and 598:
z: Height: Width: />>
- Page 599 and 600:
Figure 15-3: Testing our cross-brow
- Page 601 and 602:
object, enabling control of the con
- Page 603 and 604:
} ("") : ("lightblue")); // IE can'
- Page 605 and 606:
DOM Level 2 style of event listener
- Page 607 and 608:
#mirror {border-style: solid; borde
- Page 609 and 610:
Notice how, in the preceding examp
- Page 611 and 612:
What's my style? Take 2 p { text-
- Page 613 and 614:
Figure 15-6: A simple DHTML page tr
- Page 615 and 616:
- Page 617 and 618:
} if (clipleft A point of intere
- Page 619 and 620:
obots!');" 'If you like our domes,
- Page 621 and 622:
{ } currentX = getX('ufo'); if (cur
- Page 623 and 624:
} if (layerobject) else return(pars
- Page 625 and 626:
} /* move left until boundary */ fu
- Page 627 and 628:
We could modify the animation
- Page 629 and 630:
should not be placed within a form
- Page 631 and 632:
Select Navigation
- Page 633 and 634:
E-commerce ------------------------
- Page 635 and 636:
JavaScriptRef
- Page 637 and 638:
- Page 639 and 640:
Yahoo Teoma MSN DMOZ E-commerce S
- Page 641 and 642:
JavaScript libraries on the Web suc
- Page 643 and 644:
} } { alert("Main window went away.
- Page 645 and 646:
Although the following code is writ
- Page 647 and 648:
{ // else move it 5 more pixels in
- Page 650 and 651:
Figure 16-5: The slide-in menu in a
- Page 652 and 653:
else if (document.all) // else if i
- Page 654 and 655:
Bottom of the page As with all
- Page 656 and 657:
application of this technology is t
- Page 658 and 659:
When you assign a new cookie value
- Page 660 and 661:
array else { // extract its value }
- Page 662 and 663:
a user with the cookie ―username=
- Page 664 and 665:
If the user doesn‘t have cookies
- Page 666 and 667:
} } } value = document.cookie.subst
- Page 668 and 669:
Where a calculator on the ENIAC is
- Page 670 and 671:
Enter some text to store: When
- Page 672 and 673:
Table 17-1: Navigator Properties fo
- Page 674 and 675:
Notice already from Figure 17-1 th
- Page 676 and 677:
document.write("Browser Not Known:
- Page 678 and 679:
Error: No JavaScript Support E
- Page 680 and 681:
// JS 1.5 features var version="1.
- Page 682 and 683:
else alert("You have Flash!"); aler
- Page 684 and 685:
A rendering of the example is show
- Page 686 and 687:
* nasty hack to deal with doctype s
- Page 689 and 690:
Under browsers like Internet Explor
- Page 691 and 692:
"http://www.w3.org/TR/xhtml1/DTD/xh
- Page 693 and 694:
Figure 17-2: Explorer’s client ca
- Page 695 and 696:
Given that some buttons can b
- Page 697 and 698:
Given the danger involved in settin
- Page 699 and 700:
Part V: Advanced Topics Chapter Lis
- Page 701 and 702:
Your browser does not support Java!
- Page 703 and 704:
} public void paint(Graphics myScre
- Page 705 and 706:
Your browser does not support Java!
- Page 707 and 708:
Plug-ins are persistent in the brow
- Page 709 and 710:
{ for (var i=0; i
- Page 711 and 712:
{ for (var i=0; i
- Page 713 and 714:
Suppose you have written some custo
- Page 715 and 716:
} function changeFrame(i) { } if (!
- Page 717 and 718:
- Page 719 and 720:
Whereas Java applets are downloaded
- Page 721 and 722:
Browsers that do not understand wi
- Page 723 and 724:
function play() { } if (!dataReady)
- Page 725 and 726:
> // you can write an image in he
- Page 727 and 728:
This chapter served as an introduct
- Page 729 and 730:
} var img = new Image(); img.src =
- Page 731 and 732:
The HTTP response code 204 ―No Co
- Page 733 and 734:
{ } // If we've already got a reque
- Page 735 and 736:
User: Deagol (check online status)
- Page 737 and 738:
One fundamental vehicle enabling se
- Page 739 and 740:
{ var params = "numstories=" Note O
- Page 741 and 742:
RPC Spellchecker
- Page 743 and 744:
+ } if (rpcResult === true) else al
- Page 745 and 746:
} var newScript = document.createEl
- Page 747 and 748:
Iframe RPC The Server Respon
- Page 749 and 750:
echo ""; ?>> In order to see this i
- Page 751 and 752:
The following example illustrates t
- Page 753 and 754:
The capability to update a page wit
- Page 755 and 756:
Figure 20-1: Well-formed XML under
- Page 757 and 758:
in which a document‘s logical str
- Page 759 and 760:
&cola; We could easily have just
- Page 761 and 762:
XSL Test Note In order to
- Page 763 and 764:
Whereas the preceding example is ra
- Page 765 and 766:
(123) 456-2222 fli@democompany.com
- Page 767 and 768:
You can reference the style
- Page 769 and 770:
directory {display: block;} employe
- Page 771 and 772:
MathML Below x + y 2 k +
- Page 773 and 774:
...HTML content... or you can refe
- Page 775 and 776:
Once you bind data into a document,
- Page 777 and 778:
We could further use the DOM proper
- Page 779 and 780:
{ var rootElement = xmldoc.document
- Page 781 and 782:
if (type == 1) { // open tag dump("
- Page 783 and 784:
-->> XML Document: Name: Title
- Page 785 and 786:
xmldoc.async = false; xmldoc.load("
- Page 787 and 788:
Name: Title: Phone: Email:
- Page 789 and 790:
Sales Executive (543) 555-5672 jone
- Page 791 and 792:
*/ var title = document.getElementB
- Page 793 and 794:
* append completed record to the do
- Page 795 and 796:
- Page 797 and 798:
} //-->> /* append completed record
- Page 799 and 800:
A fake entry http://www.javascriptr
- Page 801 and 802:
a:hover {color:#FF9900;} #feedOutpu
- Page 803 and 804:
var itemURL = itemList[i].getElemen
- Page 805 and 806:
If you inspect the preceding exam
- Page 807 and 808:
Table 21-2: Relationship Between Mi
- Page 809 and 810:
Table 21-4: Proprietary Extensions
- Page 811 and 812:
of access to select one of the memb
- Page 813 and 814:
The result is shown in Figure 21-1.
- Page 815 and 816:
You must also indicate the comments
- Page 817 and 818:
Table 21-7: Some Proprietary Featur
- Page 819 and 820:
encountered. The browser generally
- Page 821 and 822: Two problematic questions are how t
- Page 823 and 824: HTML Applications HTML Applications
- Page 825 and 826: } var fso, filehandle; //-->> fso =
- Page 827 and 828: E, Elephant F, Fox G, Girl H, Hat T
- Page 829 and 830: Figure 21-3: Data Binding example u
- Page 831 and 832: Figure 21-5: Using dynamic properti
- Page 833 and 834: arbitrary elements in a page. HTCs
- Page 835: var originalColor; function activat
- Page 838 and 839: Table 21-12: Some Default Behaviors
- Page 840 and 841: Figure 21-6: Pop-up windows give yo
- Page 842 and 843: There are numerous JScript capabili
- Page 844 and 845: Note Interested readers can learn m
- Page 846 and 847: Table 21-17: Components of Mozilla
- Page 848 and 849: comes from a trusted source. Such c
- Page 850 and 851: even if the page in that window was
- Page 852 and 853: of incorporation, domain name owner
- Page 854 and 855: Figure 22-2: Categorizing sites int
- Page 856 and 857: The column of Table 22-3 indicating
- Page 858 and 859: function doitagain() { } document.w
- Page 860 and 861: escape(document.cookie); This scri
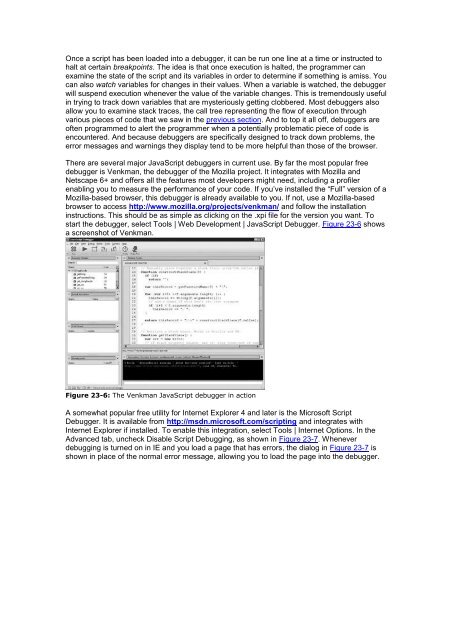
- Page 862 and 863: Although some defensive programming
- Page 864 and 865: Figure 23-1: Enabling notification
- Page 866 and 867: Table 23-2: Common JavaScript Error
- Page 868 and 869: if (debugging) alert("Returned from
- Page 870 and 871: Figure 23-4: Using Error.stack to g
- Page 874 and 875: Figure 23-7: Enabling script debugg
- Page 876 and 877: you can replace or suppress the err
- Page 878 and 879: if (window.opener && !window.opener
- Page 880 and 881: } return true; window.onerror = rep
- Page 882 and 883: You can also create instances of th
- Page 884 and 885: if (typeof(a) != "number" || typeof
- Page 886 and 887: The appearance of a browser to supp
- Page 889 and 890:
- Page 891 and 892: efresher. We now turn our attention
- Page 893 and 894: teksasliunescape(teks);document.wri
- Page 895 and 896: Standard Version Description ECMASc
- Page 897 and 898: Table A-7: Primitive JavaScript Dat
- Page 899 and 900: Table A-11: Result of Type Conversi
- Page 901 and 902: Object Description Array Provides a
- Page 903 and 904: new Function(["arg1", ["arg2"], …
- Page 905 and 906: Table A-21: Binary and Self-assignm
- Page 907 and 908: A JavaScript implementation should
- Page 909 and 910: } where statements is composed of z
- Page 911 and 912: switch (expression) { } case val1:
- Page 913 and 914: document.write(i+""); i++; } while
- Page 915 and 916: Table A-27: Some Regular Expression
- Page 917 and 918: Table A-32: Advanced Regular Expres
- Page 919 and 920: Figure B-2: The traditional object
- Page 921 and 922: Figure B-6: The Internet Explorer 4
- Page 923 and 924:
className String holding value of t
- Page 925 and 926:
eadyState Read-only string containi
- Page 927 and 928:
fireEvent(handler [, event]) Causes
- Page 929 and 930:
setExpression(property, expression
- Page 931 and 932:
Supported in IE4+, MOZ/N6+, DOM1. N
- Page 933 and 934:
This object has the following prope
- Page 935 and 936:
In Netscape 4.0-4.05 (JavaScript 1.
- Page 937 and 938:
ig, HTMLElement (Document Object) T
- Page 939 and 940:
constructor Reference to the constr
- Page 941 and 942:
caption, HTMLTableCaptionElement (D
- Page 943 and 944:
clipboardData (Proprietary Browser
- Page 945 and 946:
"move", "copyLink", "copyMove", "li
- Page 947 and 948:
setDate(dayOfMonth) Sets the day of
- Page 949 and 950:
Supported in Internet Explorer 4+,
- Page 951 and 952:
Document (Document Object) The Docu
- Page 953 and 954:
styleSheets[] Collection of styleSh
- Page 955 and 956:
Methods This object has only the me
- Page 957 and 958:
The message string defines the text
- Page 959 and 960:
properties ALT_MASK, CONTROL_MASK,
- Page 961 and 962:
setCapture([containerCapture]) Caus
- Page 963 and 964:
onblur Fires when an element loses
- Page 965 and 966:
Netscape Extended Events The follow
- Page 967 and 968:
onresizeend Fires when the user fin
- Page 969 and 970:
This object has the following metho
- Page 971 and 972:
Support Supported in Internet Explo
- Page 973 and 974:
Constructor This object cannot be i
- Page 975 and 976:
Individual entries in the history a
- Page 977 and 978:
scrolling String specifying whether
- Page 979 and 980:
"hidden", "image", and "button". Tr
- Page 981 and 982:
Despite being a tag found within a
- Page 983 and 984:
This object has the following prope
- Page 985 and 986:
Generally speaking, reserved words
- Page 987 and 988:
Index Symbols -- (decrement) operat
- Page 989 and 990:
ActiveXObject, 655-657, 772 addEven
- Page 991 and 992:
properties, 775 removing elements,
- Page 993 and 994:
ody object, HTMLBodyElement, 780-78
- Page 995 and 996:
dataTransfer, 788-789 external, 817
- Page 997 and 998:
passing composite types, 115-116 pa
- Page 999 and 1000:
speed of writing, 724 value of comm
- Page 1001 and 1002:
overview of, 522 parsing, 525-526 r
- Page 1003 and 1004:
undefined, 58-60 dataTransfer objec
- Page 1005 and 1006:
ollovers, 498-499 sparing use of DH
- Page 1007 and 1008:
document objects, 761-769 abbr, 771
- Page 1009 and 1010:
optGroup, 851 option, 851-852 overv
- Page 1011 and 1012:
document tree navigation, browser d
- Page 1013 and 1014:
dynamic typing, 29-31, 155 Index_E
- Page 1015 and 1016:
special characters, 54-55 strings,
- Page 1017 and 1018:
defined, 297 overview of, 298 Event
- Page 1019 and 1020:
advantages/disadvantages, 16 functi
- Page 1021 and 1022:
properties, 417-419 form validation
- Page 1023 and 1024:
passing primitive types by value, 1
- Page 1025 and 1026:
HTML applications (HTA), 657-660, 6
- Page 1027 and 1028:
Radio, 856-857 Reset, 859-860 submi
- Page 1029 and 1030:
events, 814-817 hiding proprietary
- Page 1031 and 1032:
one-way communication with servers,
- Page 1033 and 1034:
Java applets accessing in JavaScrip
- Page 1035 and 1036:
keyboard masking, 453-454 keywords
- Page 1037 and 1038:
syntax, 737-738 variable declaratio
- Page 1039 and 1040:
methods common to all objects, 145-
- Page 1041 and 1042:
owser supporting, 134 javaEnabled(
- Page 1043 and 1044:
null data type conversion of, 734 d
- Page 1045 and 1046:
objects, 133-158 as associative arr
- Page 1047 and 1048:
comparison. see comparison operator
- Page 1049 and 1050:
IE security zones, 686-690 Mozilla,
- Page 1051 and 1052:
prototypes, extending Array objects
- Page 1053 and 1054:
string methods, 211-214 syntax, 748
- Page 1055 and 1056:
RPCs (remote procedure calls) callb
- Page 1057 and 1058:
ActiveXObject, 655-656 browser issu
- Page 1059 and 1060:
square brackets ([ ]), 93, 198 src
- Page 1061 and 1062:
functions made accessible by, 135 m
- Page 1063 and 1064:
logical operators, 740 loops, 746-7
- Page 1065 and 1066:
methods common to all objects, 145-
- Page 1067 and 1068:
Index_V V valid XML, 607-608 value,
- Page 1069 and 1070:
document property, 134 DOM methods
- Page 1071 and 1072:
eference book, 6 referencing elemen
- Page 1073 and 1074:
List of Figures Chapter 1: Introduc
- Page 1075 and 1076:
Figure 11-1: A click on the bold te
- Page 1077 and 1078:
Figure 20-7: XHTML with MathML and
- Page 1079 and 1080:
List of Tables Chapter 1: Introduct
- Page 1081 and 1082:
Table 10-3: DOM Level 0 Collections
- Page 1083 and 1084:
Table 15-2: Position-Related Proper
- Page 1085 and 1086:
Table A-13: Result of Type Conversi