The Airport Economy 2016_Sydney Only

You also want an ePaper? Increase the reach of your titles
YUMPU automatically turns print PDFs into web optimized ePapers that Google loves.
Arrivals<br />
Departing<br />
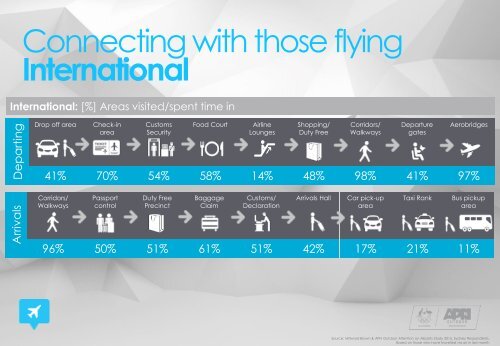
Connecting with those flying<br />
International<br />
International: [%] Areas visited/spent time in<br />
Drop off area<br />
Check-in<br />
area<br />
Customs<br />
Security<br />
Food Court<br />
Airline<br />
Lounges<br />
Shopping/<br />
Duty Free<br />
Corridors/<br />
Walkways<br />
Departure<br />
gates<br />
Aerobridges<br />
41% 70% 54% 58% 14% 48% 98% 41% 97%<br />
Corridors/<br />
Walkways<br />
Passport<br />
control<br />
Duty Free<br />
Precinct<br />
Baggage<br />
Claim<br />
Customs/<br />
Declaration<br />
Arrivals Hall<br />
Car pick-up<br />
area<br />
Taxi Rank<br />
Bus pickup<br />
area<br />
96% 50% 51% 61% 51% 42% 17% 21% 11%<br />
Source: Millward Brown & APN Outdoor Attention on <strong>Airport</strong>s Study 2015. <strong>Sydney</strong> Respondents.<br />
Based on those who have travelled via air in last month