

Handbook of best practices
Handbook%20of%20best%20practices
Handbook%20of%20best%20practices

You also want an ePaper? Increase the reach of your titles
YUMPU automatically turns print PDFs into web optimized ePapers that Google loves.
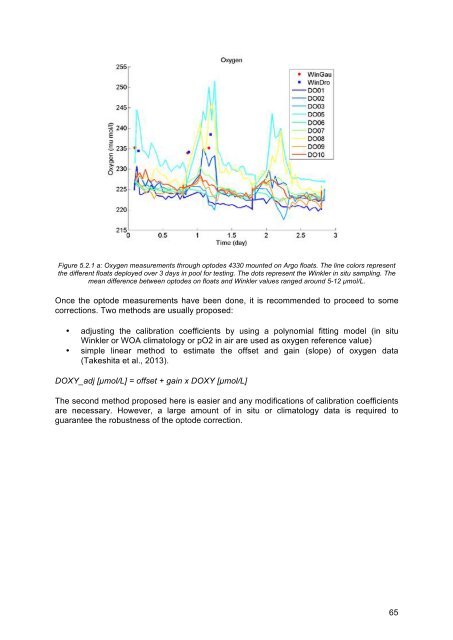
Figure 5.2.1 a: Oxygen measurements through optodes 4330 mounted on Argo floats. The line colors represent<br />
the different floats deployed over 3 days in pool for testing. The dots represent the Winkler in situ sampling. The<br />
mean difference between optodes on floats and Winkler values ranged around 5-12 µmol/L.<br />
Once the optode measurements have been done, it is recommended to proceed to some<br />
corrections. Two methods are usually proposed:<br />
• adjusting the calibration coefficients by using a polynomial fitting model (in situ<br />
Winkler or WOA climatology or pO2 in air are used as oxygen reference value)<br />
• simple linear method to estimate the <strong>of</strong>fset and gain (slope) <strong>of</strong> oxygen data<br />
(Takeshita et al., 2013).<br />
DOXY_adj [µmol/L] = <strong>of</strong>fset + gain x DOXY [µmol/L]<br />
The second method proposed here is easier and any modifications <strong>of</strong> calibration coefficients<br />
are necessary. However, a large amount <strong>of</strong> in situ or climatology data is required to<br />
guarantee the robustness <strong>of</strong> the optode correction.<br />
65