

SOYBEAN RESEARCH
Soybean-Research-14(2)-2016
Soybean-Research-14(2)-2016

You also want an ePaper? Increase the reach of your titles
YUMPU automatically turns print PDFs into web optimized ePapers that Google loves.
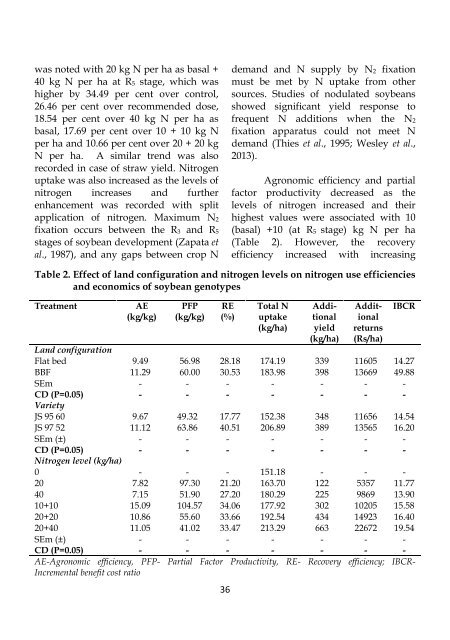
was noted with 20 kg N per ha as basal +<br />
40 kg N per ha at R 5 stage, which was<br />
higher by 34.49 per cent over control,<br />
26.46 per cent over recommended dose,<br />
18.54 per cent over 40 kg N per ha as<br />
basal, 17.69 per cent over 10 + 10 kg N<br />
per ha and 10.66 per cent over 20 + 20 kg<br />
N per ha. A similar trend was also<br />
recorded in case of straw yield. Nitrogen<br />
uptake was also increased as the levels of<br />
nitrogen increases and further<br />
enhancement was recorded with split<br />
application of nitrogen. Maximum N 2<br />
fixation occurs between the R 3 and R 5<br />
stages of soybean development (Zapata et<br />
al., 1987), and any gaps between crop N<br />
demand and N supply by N 2 fixation<br />
must be met by N uptake from other<br />
sources. Studies of nodulated soybeans<br />
showed significant yield response to<br />
frequent N additions when the N 2<br />
fixation apparatus could not meet N<br />
demand (Thies et al., 1995; Wesley et al.,<br />
2013).<br />
Agronomic efficiency and partial<br />
factor productivity decreased as the<br />
levels of nitrogen increased and their<br />
highest values were associated with 10<br />
(basal) +10 (at R 5 stage) kg N per ha<br />
(Table 2). However, the recovery<br />
efficiency increased with increasing<br />
Table 2. Effect of land configuration and nitrogen levels on nitrogen use efficiencies<br />
and economics of soybean genotypes<br />
Treatment<br />
AE<br />
(kg/kg)<br />
PFP<br />
(kg/kg)<br />
RE<br />
(%)<br />
36<br />
Total N<br />
uptake<br />
(kg/ha)<br />
Additional<br />
yield<br />
(kg/ha)<br />
Additional<br />
returns<br />
(Rs/ha)<br />
IBCR<br />
Land configuration<br />
Flat bed 9.49 56.98 28.18 174.19 339 11605 14.27<br />
BBF 11.29 60.00 30.53 183.98 398 13669 49.88<br />
SEm - - - - - - -<br />
CD (P=0.05) - - - - - - -<br />
Variety<br />
JS 95 60 9.67 49.32 17.77 152.38 348 11656 14.54<br />
JS 97 52 11.12 63.86 40.51 206.89 389 13565 16.20<br />
SEm (±) - - - - - - -<br />
CD (P=0.05) - - - - - - -<br />
Nitrogen level (kg/ha)<br />
0 - - - 151.18 - - -<br />
20 7.82 97.30 21.20 163.70 122 5357 11.77<br />
40 7.15 51.90 27.20 180.29 225 9869 13.90<br />
10+10 15.09 104.57 34.06 177.92 302 10205 15.58<br />
20+20 10.86 55.60 33.66 192.54 434 14923 16.40<br />
20+40 11.05 41.02 33.47 213.29 663 22672 19.54<br />
SEm (±) - - - - - - -<br />
CD (P=0.05) - - - - - - -<br />
AE-Agronomic efficiency, PFP- Partial Factor Productivity, RE- Recovery efficiency; IBCR-<br />
Incremental benefit cost ratio