

Brown & Brown Insurance 2016 Annual Report
2016 Annual Report
2016 Annual Report

Create successful ePaper yourself
Turn your PDF publications into a flip-book with our unique Google optimized e-Paper software.
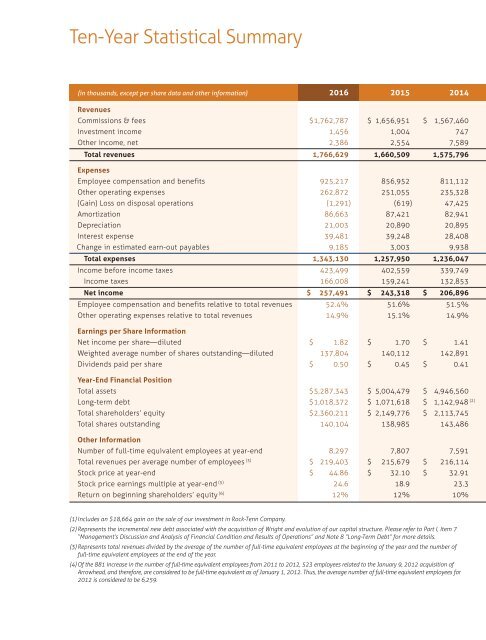
Ten-Year Statistical Summary<br />
(in thousands, except per share data and other information) <strong>2016</strong> 2015 2014<br />
Revenues<br />
Commissions & fees $ 1,762,787 $ 1,656,951 $ 1,567,460<br />
Investment income 1,456 1,004 747<br />
Other income, net 2,386 2,554 7,589<br />
Total revenues 1,766,629 1,660,509 1,575,796<br />
Expenses<br />
Employee compensation and benefits 925,217 856,952 811,112<br />
Other operating expenses 262,872 251,055 235,328<br />
(Gain) Loss on disposal operations (1,291) (619) 47,425<br />
Amortization 86,663 87,421 82,941<br />
Depreciation 21,003 20,890 20,895<br />
Interest expense 39,481 39,248 28,408<br />
Change in estimated earn-out payables 9,185 3,003 9,938<br />
Total expenses 1,343,130 1,257,950 1,236,047<br />
Income before income taxes 423,499 402,559 339,749<br />
Income taxes 166,008 159,241 132,853<br />
Net income $ 257,491 $ 243,318 $ 206,896<br />
Employee compensation and benefits relative to total revenues 52.4% 51.6% 51.5%<br />
Other operating expenses relative to total revenues 14.9% 15.1% 14.9%<br />
Earnings per Share Information<br />
Net income per share—diluted $ 1.82 $ 1.70 $ 1.41<br />
Weighted average number of shares outstanding—diluted 137,804 140,112 142,891<br />
Dividends paid per share $ 0.50 $ 0.45 $ 0.41<br />
Year-End Financial Position<br />
Total assets $ 5,287,343 $ 5,004,479 $ 4,946,560<br />
Long-term debt $ 1,018,372 $ 1,071,618 $ 1,142,948 (2)<br />
Total shareholders’ equity $ 2,360,211 $ 2,149,776 $ 2,113,745<br />
Total shares outstanding 140,104 138,985 143,486<br />
Other Information<br />
Number of full-time equivalent employees at year-end 8,297 7,807 7,591<br />
Total revenues per average number of employees (3) $ 219,403 $ 215,679 $ 216,114<br />
Stock price at year-end $ 44.86 $ 32.10 $ 32.91<br />
Stock price earnings multiple at year-end (5) 24.6 18.9 23.3<br />
Return on beginning shareholders’ equity (6) 12% 12% 10%<br />
(1) Includes an $18,664 gain on the sale of our investment in Rock-Tenn Company.<br />
(2) Represents the incremental new debt associated with the acquisition of Wright and evolution of our capital structure. Please refer to Part I, Item 7<br />
“Management’s Discussion and Analysis of Financial Condition and Results of Operations” and Note 8 “Long-Term Debt” for more details.<br />
(3) Represents total revenues divided by the average of the number of full-time equivalent employees at the beginning of the year and the number of<br />
full-time equivalent employees at the end of the year.<br />
(4) Of the 881 increase in the number of full-time equivalent employees from 2011 to 2012, 523 employees related to the January 9, 2012 acquisition of<br />
Arrowhead, and therefore, are considered to be full-time equivalent as of January 1, 2012. Thus, the average number of full-time equivalent employees for<br />
2012 is considered to be 6,259.