JofIMAB-2016-vol22-issue3

Create successful ePaper yourself
Turn your PDF publications into a flip-book with our unique Google optimized e-Paper software.
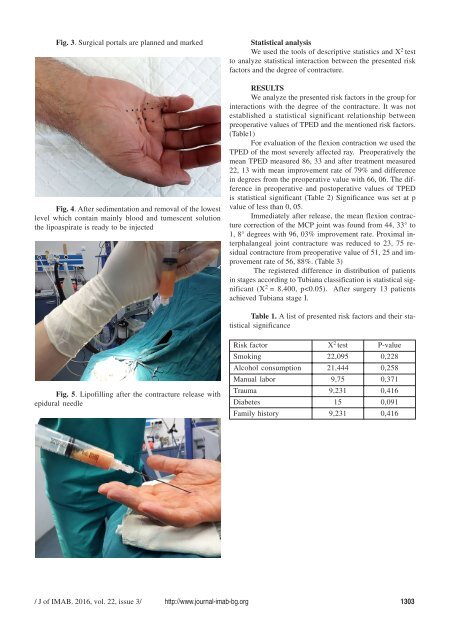
Fig. 3. Surgical portals are planned and marked<br />
Fig. 4. After sedimentation and removal of the lowest<br />
level which contain mainly blood and tumescent solution<br />
the lipoaspirate is ready to be injected<br />
Statistical analysis<br />
We used the tools of descriptive statistics and X 2 test<br />
to analyze statistical interaction between the presented risk<br />
factors and the degree of contracture.<br />
RESULTS<br />
We analyze the presented risk factors in the group for<br />
interactions with the degree of the contracture. It was not<br />
established a statistical significant relationship between<br />
preoperative values of TPED and the mentioned risk factors.<br />
(Table1)<br />
For evaluation of the flexion contraction we used the<br />
TPED of the most severely affected ray. Preoperatively the<br />
mean TPED measured 86, 33 and after treatment measured<br />
22, 13 with mean improvement rate of 79% and difference<br />
in degrees from the preoperative value with 66, 06. The difference<br />
in preoperative and postoperative values of TPED<br />
is statistical significant (Table 2) Significance was set at p<br />
value of less than 0, 05.<br />
Immediately after release, the mean flexion contracture<br />
correction of the MCP joint was found from 44, 33° to<br />
1, 8° degrees with 96, 03% improvement rate. Proximal interphalangeal<br />
joint contracture was reduced to 23, 75 residual<br />
contracture from preoperative value of 51, 25 and improvement<br />
rate of 56, 88%. (Table 3)<br />
The registered difference in distribution of patients<br />
in stages according to Tubiana classification is statistical significant<br />
(X 2 = 8.400, p