- Page 1 and 2:
At a Glance At A Glance WEEK 1 In W
- Page 3 and 4:
Day 1 Getting Your Feet Wet Week Ge
- Page 5 and 6:
Getting Your Feet Wet are divided i
- Page 7 and 8:
NOTE Getting Your Feet Wet As you m
- Page 9 and 10:
Getting Your Feet Wet but you need
- Page 11 and 12:
NOTE Getting Your Feet Wet In order
- Page 13 and 14:
NOTE Getting Your Feet Wet In C++,
- Page 15 and 16:
Getting Your Feet Wet An object, li
- Page 17 and 18:
Getting Your Feet Wet In some progr
- Page 19 and 20:
Listing 1.3. WRAPME.CPP. Getting Yo
- Page 21 and 22:
Getting Your Feet Wet Operator Desc
- Page 23 and 24:
NEW TERM Figure 1.5. Anatomy of a f
- Page 25 and 26:
SYNTAX ▼ ▲ Getting Your Feet We
- Page 27 and 28:
Getting Your Feet Wet Let’s prove
- Page 29 and 30:
Getting Your Feet Wet There is a sh
- Page 31 and 32:
Getting Your Feet Wet When the prog
- Page 33 and 34:
NOTE Function Description Getting Y
- Page 35 and 36:
NOTE Getting Your Feet Wet numbers
- Page 37 and 38:
Quiz Getting Your Feet Wet Windows
- Page 39 and 40:
Day 2 Wading In Deeper Wading In De
- Page 41 and 42:
NOTE Wading In Deeper If the condit
- Page 43 and 44:
SYNTAX ▼ ▼ TIP TIP Wading In De
- Page 45 and 46:
SYNTAX Wading In Deeper immediately
- Page 47 and 48:
Listing 2.1. FORLOOP.CPP. Wading In
- Page 49 and 50:
SYNTAX ▼ ▲ SYNTAX ▼ ▲ The w
- Page 51 and 52:
Wading In Deeper for (int i=0;i
- Page 53 and 54:
▲ default: dflt_statements; break
- Page 55 and 56:
Wading In Deeper This code generate
- Page 57 and 58:
NOTE Wading In Deeper You can creat
- Page 59 and 60:
Wading In Deeper So how do the sour
- Page 61 and 62:
Wading In Deeper 20: sizeof(listArr
- Page 63 and 64:
NOTE Wading In Deeper The displayRe
- Page 65 and 66:
Workshop Wading In Deeper The Works
- Page 67 and 68:
Day 3 Up to Your Neck in C++ Up to
- Page 69 and 70:
Up to Your Neck in C++ In this case
- Page 71 and 72:
Up to Your Neck in C++ Figure 3.1.
- Page 73 and 74:
Up to Your Neck in C++ That won’t
- Page 75 and 76:
Up to Your Neck in C++ 42: cin.getl
- Page 77 and 78:
Listing 3.2. REFERENC.CPP. Up to Yo
- Page 79 and 80:
Up to Your Neck in C++ Although it
- Page 81 and 82:
NOTE Up to Your Neck in C++ Now you
- Page 83 and 84:
Up to Your Neck in C++ If you are a
- Page 85 and 86:
NOTE Up to Your Neck in C++ If you
- Page 87 and 88:
NOTE NOTE Up to Your Neck in C++ ca
- Page 89 and 90:
Up to Your Neck in C++ Now the comp
- Page 91 and 92:
NOTE Up to Your Neck in C++ int Air
- Page 93 and 94:
Quiz Up to Your Neck in C++ Day 5,
- Page 95 and 96:
Totally Immersed: C++ Classes and O
- Page 97 and 98:
Totally Immersed: C++ Classes and O
- Page 99 and 100:
NOTE Totally Immersed: C++ Classes
- Page 101 and 102:
Totally Immersed: C++ Classes and O
- Page 103 and 104:
Totally Immersed: C++ Classes and O
- Page 105 and 106:
Totally Immersed: C++ Classes and O
- Page 107 and 108:
Totally Immersed: C++ Classes and O
- Page 109 and 110:
NOTE Totally Immersed: C++ Classes
- Page 111 and 112:
Totally Immersed: C++ Classes and O
- Page 113 and 114:
Totally Immersed: C++ Classes and O
- Page 115 and 116:
Totally Immersed: C++ Classes and O
- Page 117 and 118:
Totally Immersed: C++ Classes and O
- Page 119 and 120:
NOTE Totally Immersed: C++ Classes
- Page 121 and 122:
Totally Immersed: C++ Classes and O
- Page 123 and 124:
Totally Immersed: C++ Classes and O
- Page 125 and 126:
Totally Immersed: C++ Classes and O
- Page 127 and 128:
Totally Immersed: C++ Classes and O
- Page 129 and 130:
Totally Immersed: C++ Classes and O
- Page 131 and 132:
C++ Class Frameworks and the Visual
- Page 133 and 134:
C++ Class Frameworks and the Visual
- Page 135 and 136:
C++ Class Frameworks and the Visual
- Page 137 and 138:
C++ Class Frameworks and the Visual
- Page 139 and 140:
C++ Class Frameworks and the Visual
- Page 141 and 142:
Figure 5.1. The Object Inspector wi
- Page 143 and 144:
NOTE C++ Class Frameworks and the V
- Page 145 and 146:
C++ Class Frameworks and the Visual
- Page 147 and 148:
C++ Class Frameworks and the Visual
- Page 149 and 150:
C++ Class Frameworks and the Visual
- Page 151 and 152:
C++ Class Frameworks and the Visual
- Page 153 and 154:
C++ Class Frameworks and the Visual
- Page 155 and 156:
C++ Class Frameworks and the Visual
- Page 157 and 158:
C++ Class Frameworks and the Visual
- Page 159 and 160:
C++ Class Frameworks and the Visual
- Page 161 and 162:
C++ Class Frameworks and the Visual
- Page 163 and 164:
C++ Class Frameworks and the Visual
- Page 165 and 166:
Exercises C++ Class Frameworks and
- Page 167 and 168:
The C++Builder IDE Explored: Projec
- Page 169 and 170:
The C++Builder IDE Explored: Projec
- Page 171 and 172:
The C++Builder IDE Explored: Projec
- Page 173 and 174:
The C++Builder IDE Explored: Projec
- Page 175 and 176:
NOTE The C++Builder IDE Explored: P
- Page 177 and 178:
The C++Builder IDE Explored: Projec
- Page 179 and 180:
NOTE The C++Builder IDE Explored: P
- Page 181 and 182:
The C++Builder IDE Explored: Projec
- Page 183 and 184:
The C++Builder IDE Explored: Projec
- Page 185 and 186:
The C++Builder IDE Explored: Projec
- Page 187 and 188:
The C++Builder IDE Explored: Projec
- Page 189 and 190:
NOTE The C++Builder IDE Explored: P
- Page 191 and 192:
TIP Figure 6.11. The About box with
- Page 193 and 194:
NOTE The C++Builder IDE Explored: P
- Page 195 and 196:
The C++Builder IDE Explored: Projec
- Page 197 and 198:
The C++Builder IDE Explored: Projec
- Page 199 and 200:
The C++Builder IDE Explored: Projec
- Page 201 and 202:
NOTE The C++Builder IDE Explored: P
- Page 203 and 204:
The C++Builder IDE Explored: Projec
- Page 205 and 206:
The C++Builder IDE Explored: Projec
- Page 207 and 208:
The C++Builder IDE Explored: Projec
- Page 209 and 210:
The C++Builder IDE Explored: Projec
- Page 211 and 212:
Figure 6.18. The About box for the
- Page 213 and 214:
Figure 6.20. The Project Options di
- Page 215 and 216:
Quiz The C++Builder IDE Explored: P
- Page 217 and 218:
Working with the Form Designer and
- Page 219 and 220:
NOTE Working with the Form Designer
- Page 221 and 222:
Working with the Form Designer and
- Page 223 and 224:
Working with the Form Designer and
- Page 225 and 226:
NOTE Working with the Form Designer
- Page 227 and 228:
NOTE TIP TIP Working with the Form
- Page 229 and 230:
NOTE Working with the Form Designer
- Page 231 and 232:
Working with the Form Designer and
- Page 233 and 234:
NOTE Figure 7.10. The Alignment Pal
- Page 235 and 236:
NOTE Working with the Form Designer
- Page 237 and 238:
Working with the Form Designer and
- Page 239 and 240:
Working with the Form Designer and
- Page 241 and 242:
Working with the Form Designer and
- Page 243 and 244:
Working with the Form Designer and
- Page 245 and 246:
Working with the Form Designer and
- Page 247 and 248:
Working with the Form Designer and
- Page 249 and 250:
NOTE Working with the Form Designer
- Page 251 and 252:
Working with the Form Designer and
- Page 253 and 254:
Working with the Form Designer and
- Page 255 and 256:
Working with the Form Designer and
- Page 257 and 258:
Working with the Form Designer and
- Page 259 and 260:
Working with the Form Designer and
- Page 261 and 262:
Working with the Form Designer and
- Page 263 and 264:
Quiz Working with the Form Designer
- Page 265 and 266:
In Review In Review WEEK 1 You cove
- Page 267 and 268:
In Review displayed based on user i
- Page 269 and 270:
At a Glance At A Glance WEEK 2 Are
- Page 271 and 272:
Day 8 VCL Components VCL Components
- Page 273 and 274:
VCL Components C++Builder displays
- Page 275 and 276:
VCL Components Important Common Pro
- Page 277 and 278:
Cursors VCL Components The Cursor p
- Page 279 and 280:
Figure 8.2. The Object Inspector sh
- Page 281 and 282:
VCL Components You can set this pro
- Page 283 and 284:
VCL Components Method Description I
- Page 285 and 286:
VCL Components Similarly, when the
- Page 287 and 288:
NOTE TIP VCL Components There may b
- Page 289 and 290:
VCL Components or load the Memo wit
- Page 291 and 292:
VCL Components Item Applies To Desc
- Page 293 and 294:
VCL Components You can use owner-dr
- Page 295 and 296:
VCL Components Property Applies To
- Page 297 and 298:
VCL Components for buttons that are
- Page 299 and 300:
VCL Components property set to true
- Page 301 and 302:
NOTE VCL Components To set the glyp
- Page 303 and 304:
VCL Components The GroupIndex Prope
- Page 305 and 306:
NOTE VCL Components form. Like the
- Page 307 and 308:
VCL Components As such, they go wit
- Page 309 and 310:
VCL Components The File Open and Fi
- Page 311 and 312:
VCL Components The InitialDir Prope
- Page 313 and 314:
VCL Components The Font dialog box
- Page 315 and 316:
Quiz VCL Components Q I’m respond
- Page 317 and 318:
Day 9 Creating Applications in C++B
- Page 319 and 320:
Figure 9.1. The Object Repository w
- Page 321 and 322:
Creating Applications in C++Builder
- Page 323 and 324:
TIP Creating Applications in C++Bui
- Page 325 and 326:
NOTE NOTE Creating Applications in
- Page 327 and 328:
Figure 9.4. The Object Repository c
- Page 329 and 330:
Creating Applications in C++Builder
- Page 331 and 332:
Creating Applications in C++Builder
- Page 333 and 334:
NOTE Creating Applications in C++Bu
- Page 335 and 336:
TIP Creating Applications in C++Bui
- Page 337 and 338:
Creating Applications in C++Builder
- Page 339 and 340:
Creating Applications in C++Builder
- Page 341 and 342:
NOTE NOTE Creating Applications in
- Page 343 and 344:
Creating Applications in C++Builder
- Page 345 and 346:
Creating Applications in C++Builder
- Page 347 and 348:
Creating Applications in C++Builder
- Page 349 and 350:
Summary Creating Applications in C+
- Page 351 and 352:
Creating Applications in C++Builder
- Page 353 and 354:
More on Projects Day 10 More on Pro
- Page 355 and 356:
More on Projects The only time this
- Page 357 and 358:
TIP More on Projects You can add mo
- Page 359 and 360:
More on Projects Table 10.1. The Pr
- Page 361 and 362:
Figure 10.6. The Project Explorer s
- Page 363 and 364: ■ Forms ■ Application ■ C++
- Page 365 and 366: NOTE NOTE More on Projects if (!Abo
- Page 367 and 368: Figure 10.9. The C++ page of the Pr
- Page 369 and 370: NOTE TIP More on Projects To avoid
- Page 371 and 372: NOTE More on Projects Compiler and
- Page 373 and 374: More on Projects The Show warnings
- Page 375 and 376: More on Projects The C++Builder Cod
- Page 377 and 378: NOTE More on Projects If you open a
- Page 379 and 380: More on Projects menu or press Ctrl
- Page 381 and 382: Figure 10.13. The Code Editor with
- Page 383 and 384: More on Projects find a matching br
- Page 385 and 386: More on Projects The Editor Page Th
- Page 387 and 388: NOTE More on Projects I usually get
- Page 389 and 390: Quiz More on Projects Q When I star
- Page 391 and 392: More on Projects 8. Continuing with
- Page 393 and 394: Using the Debugger Day 11 Using the
- Page 395 and 396: Using the Debugger Item Shortcut De
- Page 397 and 398: NOTE Using the Debugger is highligh
- Page 399 and 400: NOTE Using the Debugger any conditi
- Page 401 and 402: Using the Debugger Conditional Brea
- Page 403 and 404: Using the Debugger The variable nam
- Page 405 and 406: Using the Debugger The fastest way
- Page 407 and 408: Using the Debugger The Watch List i
- Page 409 and 410: NOTE Using the Debugger When you us
- Page 411 and 412: NOTE Using the Debugger The Methods
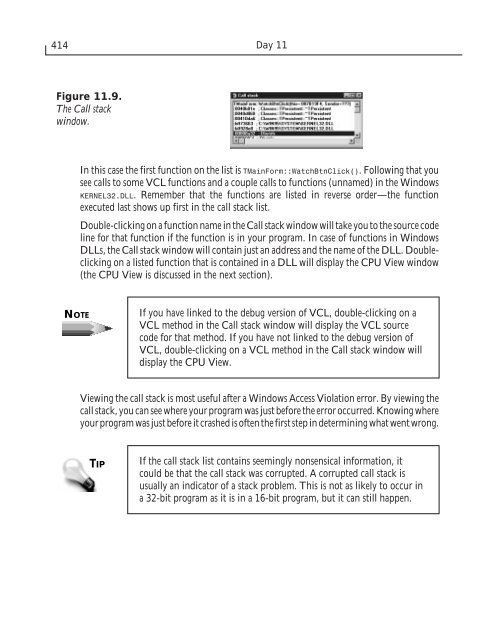
- Page 413: NOTE Using the Debugger in the Eval
- Page 417 and 418: NOTE Using the Debugger builds. Rem
- Page 419 and 420: Using the Debugger macros, TRACE an
- Page 421 and 422: Using the Debugger The diagnostic m
- Page 423 and 424: Using the Debugger ■ Ordinarily y
- Page 425 and 426: Quiz Using the Debugger 1. How do y
- Page 427 and 428: C++Builder Database Architecture Da
- Page 429 and 430: C++Builder Database Architecture Te
- Page 431 and 432: C++Builder Database Architecture an
- Page 433 and 434: C++Builder Database Architecture
- Page 435 and 436: C++Builder Database Architecture Pr
- Page 437 and 438: C++Builder Database Architecture Th
- Page 439 and 440: C++Builder Database Architecture To
- Page 441 and 442: C++Builder Database Architecture Th
- Page 443 and 444: C++Builder Database Architecture Pr
- Page 445 and 446: Event Catalyst C++Builder Database
- Page 447 and 448: WARNING C++Builder Database Archite
- Page 449 and 450: C++Builder Database Architecture Lo
- Page 451 and 452: C++Builder Database Architecture A
- Page 453 and 454: C++Builder Database Architecture Pr
- Page 455 and 456: C++Builder Database Architecture da
- Page 457 and 458: C++Builder Database Architecture Th
- Page 459 and 460: Method Function C++Builder Database
- Page 461 and 462: C++Builder Database Architecture St
- Page 463 and 464: C++Builder Database Architecture Ta
- Page 465 and 466:
C++Builder Database Architecture Ta
- Page 467 and 468:
C++Builder Database Architecture Up
- Page 469 and 470:
C++Builder Database Architecture Ke
- Page 471 and 472:
TIP C++Builder Database Architectur
- Page 473 and 474:
Building Internet Applications Day
- Page 475 and 476:
Building Internet Applications Tabl
- Page 477 and 478:
Building Internet Applications prop
- Page 479 and 480:
Building Internet Applications Noti
- Page 481 and 482:
Building Internet Applications 20:
- Page 483 and 484:
Building Internet Applications 65:
- Page 485 and 486:
Quiz Building Internet Applications
- Page 487 and 488:
C++Builder Extensions to C++ Day 14
- Page 489 and 490:
C++Builder Extensions to C++ compil
- Page 491 and 492:
C++Builder Extensions to C++ Anothe
- Page 493 and 494:
C++Builder Extensions to C++ __int8
- Page 495 and 496:
C++Builder Extensions to C++ value
- Page 497 and 498:
C++Builder Extensions to C++ you ca
- Page 499 and 500:
In Review In Review WEEK 2 Wow, tha
- Page 501 and 502:
Answers to Quiz Questions APPENDIX
- Page 503 and 504:
Day 3 Day 4 Answers to Quiz Questio
- Page 505 and 506:
Answers to Quiz Questions 4. Hold d
- Page 507 and 508:
Day 10 Answers to Quiz Questions 1.
- Page 509 and 510:
Symbols & (ampersands), 246 © (cop
- Page 511 and 512:
C C (programming language), 132 C c
- Page 513 and 514:
File Save, 309-312 Find/Replace, 31
- Page 515 and 516:
Insert Template, 248 Object Reposit
- Page 517 and 518:
Cascade( ), 198 Close( ), 198 Close
- Page 519 and 520:
Layout property (BitBtn component),
- Page 521 and 522:
object-oriented programming, see OO
- Page 523 and 524:
protected member functions, 106 pro
- Page 525 and 526:
structures arrays, 58 C vs. C++, 64
- Page 527 and 528:
A V I A C O M S E R V I C E The Inf
- Page 529 and 530:
Component Palette Quick Reference S
- Page 531 and 532:
Add to Your Sams Library Today with
- Page 533 and 534:
Overview Introduction Introduction
- Page 535 and 536:
Introduction VCL Explored .........