Hotelier Editon 29 2017

You also want an ePaper? Increase the reach of your titles
YUMPU automatically turns print PDFs into web optimized ePapers that Google loves.
HOT | REPORTS<br />
Hotel & Branded Residences<br />
Bali<br />
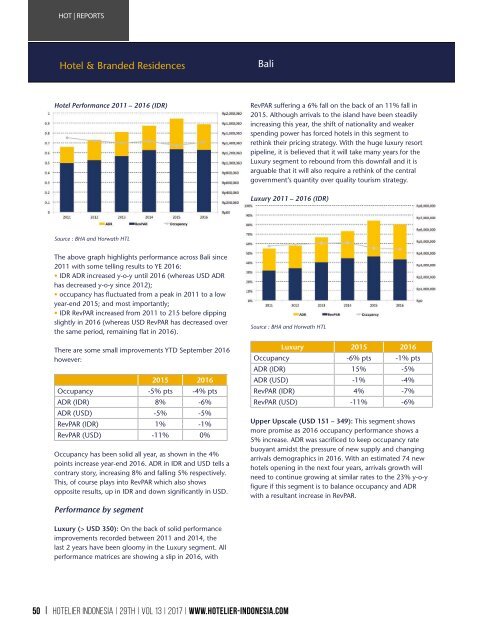
Hotel Performance 2011 – 2016 (IDR)<br />
RevPAR suffering a 6% fall on the back of an 11% fall in<br />
2015. Although arrivals to the island have been steadily<br />
increasing this year, the shift of nationality and weaker<br />
spending power has forced hotels in this segment to<br />
rethink their pricing strategy. With the huge luxury resort<br />
pipeline, it is believed that it will take many years for the<br />
Luxury segment to rebound from this downfall and it is<br />
arguable that it will also require a rethink of the central<br />
government’s quantity over quality tourism strategy.<br />
Luxury 2011 – 2016 (IDR)<br />
Source : BHA and Horwath HTL<br />
The above graph highlights performance across Bali since<br />
2011 with some telling results to YE 2016:<br />
• IDR ADR increased y-o-y until 2016 (whereas USD ADR<br />
has decreased y-o-y since 2012);<br />
• occupancy has fluctuated from a peak in 2011 to a low<br />
year-end 2015; and most importantly;<br />
• IDR RevPAR increased from 2011 to 215 before dipping<br />
slightly in 2016 (whereas USD RevPAR has decreased over<br />
the same period, remaining flat in 2016).<br />
There are some small improvements YTD September 2016<br />
however:<br />
2015 2016<br />
Occupancy -5% pts -4% pts<br />
ADR (IDR) 8% -6%<br />
ADR (USD) -5% -5%<br />
RevPAR (IDR) 1% -1%<br />
RevPAR (USD) -11% 0%<br />
Occupancy has been solid all year, as shown in the 4%<br />
points increase year-end 2016. ADR in IDR and USD tells a<br />
contrary story, increasing 8% and falling 5% respectively.<br />
This, of course plays into RevPAR which also shows<br />
opposite results, up in IDR and down significantly in USD.<br />
Performance by segment<br />
Source : BHA and Horwath HTL<br />
Luxury 2015 2016<br />
Occupancy -6% pts -1% pts<br />
ADR (IDR) 15% -5%<br />
ADR (USD) -1% -4%<br />
RevPAR (IDR) 4% -7%<br />
RevPAR (USD) -11% -6%<br />
Upper Upscale (USD 151 – 349): This segment shows<br />
more promise as 2016 occupancy performance shows a<br />
5% increase. ADR was sacrificed to keep occupancy rate<br />
buoyant amidst the pressure of new supply and changing<br />
arrivals demographics in 2016. With an estimated 74 new<br />
hotels opening in the next four years, arrivals growth will<br />
need to continue growing at similar rates to the 23% y-o-y<br />
figure if this segment is to balance occupancy and ADR<br />
with a resultant increase in RevPAR.<br />
Luxury (> USD 350): On the back of solid performance<br />
improvements recorded between 2011 and 2014, the<br />
last 2 years have been gloomy in the Luxury segment. All<br />
performance matrices are showing a slip in 2016, with<br />
HOTELIER INDONESIA | <strong>29</strong>th | Vol 13 | <strong>2017</strong> | www.hotelier-indonesia.com<br />
50 www.horwathhtl.com<br />
www.c9hotelworks.com