MAA - Oracle 10gR2 Redo Transport and Network Best Practices
MAA - Oracle 10gR2 Redo Transport and Network Best Practices
MAA - Oracle 10gR2 Redo Transport and Network Best Practices

You also want an ePaper? Increase the reach of your titles
YUMPU automatically turns print PDFs into web optimized ePapers that Google loves.
Maximum Availability Architecture<br />
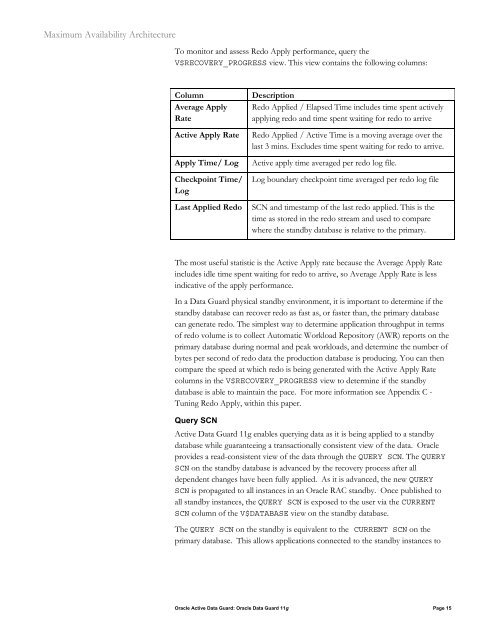
To monitor <strong>and</strong> assess <strong>Redo</strong> Apply performance, query the<br />
V$RECOVERY_PROGRESS view. This view contains the following columns:<br />
Column Description<br />
Average Apply<br />
Rate<br />
<strong>Redo</strong> Applied / Elapsed Time includes time spent actively<br />
applying redo <strong>and</strong> time spent waiting for redo to arrive<br />
Active Apply Rate <strong>Redo</strong> Applied / Active Time is a moving average over the<br />
last 3 mins. Excludes time spent waiting for redo to arrive.<br />
Apply Time/ Log Active apply time averaged per redo log file.<br />
Checkpoint Time/<br />
Log<br />
Log boundary checkpoint time averaged per redo log file<br />
Last Applied <strong>Redo</strong> SCN <strong>and</strong> timestamp of the last redo applied. This is the<br />
time as stored in the redo stream <strong>and</strong> used to compare<br />
where the st<strong>and</strong>by database is relative to the primary.<br />
The most useful statistic is the Active Apply rate because the Average Apply Rate<br />
includes idle time spent waiting for redo to arrive, so Average Apply Rate is less<br />
indicative of the apply performance.<br />
In a Data Guard physical st<strong>and</strong>by environment, it is important to determine if the<br />
st<strong>and</strong>by database can recover redo as fast as, or faster than, the primary database<br />
can generate redo. The simplest way to determine application throughput in terms<br />
of redo volume is to collect Automatic Workload Repository (AWR) reports on the<br />
primary database during normal <strong>and</strong> peak workloads, <strong>and</strong> determine the number of<br />
bytes per second of redo data the production database is producing. You can then<br />
compare the speed at which redo is being generated with the Active Apply Rate<br />
columns in the V$RECOVERY_PROGRESS view to determine if the st<strong>and</strong>by<br />
database is able to maintain the pace. For more information see Appendix C -<br />
Tuning <strong>Redo</strong> Apply, within this paper.<br />
Query SCN<br />
Active Data Guard 11g enables querying data as it is being applied to a st<strong>and</strong>by<br />
database while guaranteeing a transactionally consistent view of the data. <strong>Oracle</strong><br />
provides a read-consistent view of the data through the QUERY SCN. The QUERY<br />
SCN on the st<strong>and</strong>by database is advanced by the recovery process after all<br />
dependent changes have been fully applied. As it is advanced, the new QUERY<br />
SCN is propagated to all instances in an <strong>Oracle</strong> RAC st<strong>and</strong>by. Once published to<br />
all st<strong>and</strong>by instances, the QUERY SCN is exposed to the user via the CURRENT<br />
SCN column of the V$DATABASE view on the st<strong>and</strong>by database.<br />
The QUERY SCN on the st<strong>and</strong>by is equivalent to the CURRENT SCN on the<br />
primary database. This allows applications connected to the st<strong>and</strong>by instances to<br />
<strong>Oracle</strong> Active Data Guard: <strong>Oracle</strong> Data Guard 11g Page 15