MAA - Oracle 10gR2 Redo Transport and Network Best Practices
MAA - Oracle 10gR2 Redo Transport and Network Best Practices
MAA - Oracle 10gR2 Redo Transport and Network Best Practices

Create successful ePaper yourself
Turn your PDF publications into a flip-book with our unique Google optimized e-Paper software.
Maximum Availability Architecture<br />
select 'Instance'||thread#||': Last Applied='||max(sequence#)||'<br />
resetlogs_change#='||resetlogs_change#||')'<br />
from v$archived_log<br />
where applied = (select decode(database_role, 'PRIMARY', 'NO', 'YES')<br />
from v$database)<strong>and</strong> thread# in (select thread# from gv$instance)<br />
<strong>and</strong> resetlogs_change# = (select resetlogs_change# from v$database)<br />
group by thread#, resetlogs_change#<br />
order by thread#;<br />
The above query will return the latest sequence applied on the st<strong>and</strong>by as well as<br />
the latest sequence archived on the primary database for each thread. There is an<br />
archive log gap if the last applied sequence on the st<strong>and</strong>by is one or more<br />
sequences behind the latest archived on the primary.<br />
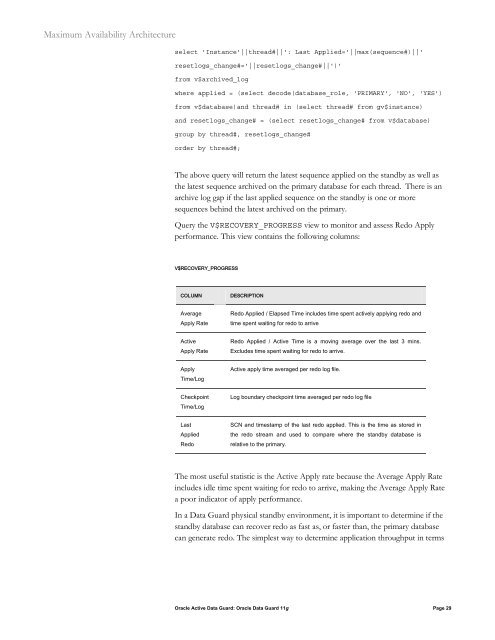
Query the V$RECOVERY_PROGRESS view to monitor <strong>and</strong> assess <strong>Redo</strong> Apply<br />
performance. This view contains the following columns:<br />
V$RECOVERY_PROGRESS<br />
COLUMN DESCRIPTION<br />
Average<br />
Apply Rate<br />
Active<br />
Apply Rate<br />
Apply<br />
Time/Log<br />
Checkpoint<br />
Time/Log<br />
Last<br />
Applied<br />
<strong>Redo</strong><br />
<strong>Redo</strong> Applied / Elapsed Time includes time spent actively applying redo <strong>and</strong><br />
time spent waiting for redo to arrive<br />
<strong>Redo</strong> Applied / Active Time is a moving average over the last 3 mins.<br />
Excludes time spent waiting for redo to arrive.<br />
Active apply time averaged per redo log file.<br />
Log boundary checkpoint time averaged per redo log file<br />
SCN <strong>and</strong> timestamp of the last redo applied. This is the time as stored in<br />
the redo stream <strong>and</strong> used to compare where the st<strong>and</strong>by database is<br />
relative to the primary.<br />
The most useful statistic is the Active Apply rate because the Average Apply Rate<br />
includes idle time spent waiting for redo to arrive, making the Average Apply Rate<br />
a poor indicator of apply performance.<br />
In a Data Guard physical st<strong>and</strong>by environment, it is important to determine if the<br />
st<strong>and</strong>by database can recover redo as fast as, or faster than, the primary database<br />
can generate redo. The simplest way to determine application throughput in terms<br />
<strong>Oracle</strong> Active Data Guard: <strong>Oracle</strong> Data Guard 11g Page 29