MAA - Oracle 10gR2 Redo Transport and Network Best Practices
MAA - Oracle 10gR2 Redo Transport and Network Best Practices
MAA - Oracle 10gR2 Redo Transport and Network Best Practices
You also want an ePaper? Increase the reach of your titles
YUMPU automatically turns print PDFs into web optimized ePapers that Google loves.
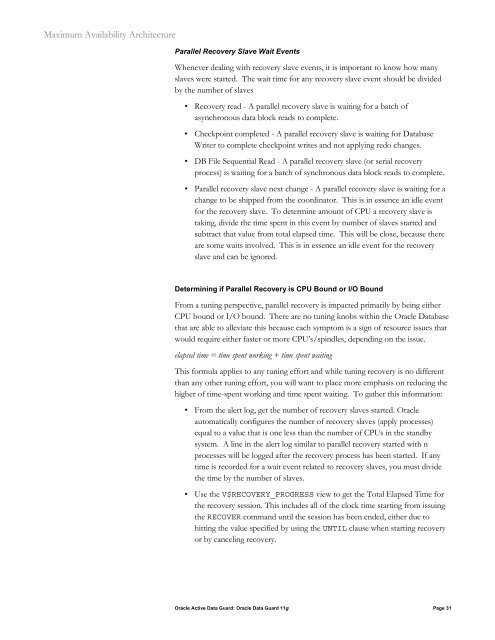
Maximum Availability Architecture<br />
Parallel Recovery Slave Wait Events<br />
Whenever dealing with recovery slave events, it is important to know how many<br />
slaves were started. The wait time for any recovery slave event should be divided<br />
by the number of slaves<br />
• Recovery read - A parallel recovery slave is waiting for a batch of<br />
asynchronous data block reads to complete.<br />
• Checkpoint completed - A parallel recovery slave is waiting for Database<br />
Writer to complete checkpoint writes <strong>and</strong> not applying redo changes.<br />
• DB File Sequential Read - A parallel recovery slave (or serial recovery<br />
process) is waiting for a batch of synchronous data block reads to complete.<br />
• Parallel recovery slave next change - A parallel recovery slave is waiting for a<br />
change to be shipped from the coordinator. This is in essence an idle event<br />
for the recovery slave. To determine amount of CPU a recovery slave is<br />
taking, divide the time spent in this event by number of slaves started <strong>and</strong><br />
subtract that value from total elapsed time. This will be close, because there<br />
are some waits involved. This is in essence an idle event for the recovery<br />
slave <strong>and</strong> can be ignored.<br />
Determining if Parallel Recovery is CPU Bound or I/O Bound<br />
From a tuning perspective, parallel recovery is impacted primarily by being either<br />
CPU bound or I/O bound. There are no tuning knobs within the <strong>Oracle</strong> Database<br />
that are able to alleviate this because each symptom is a sign of resource issues that<br />
would require either faster or more CPU’s/spindles, depending on the issue.<br />
elapsed time = time spent working + time spent waiting<br />
This formula applies to any tuning effort <strong>and</strong> while tuning recovery is no different<br />
than any other tuning effort, you will want to place more emphasis on reducing the<br />
higher of time-spent working <strong>and</strong> time spent waiting. To gather this information:<br />
• From the alert log, get the number of recovery slaves started. <strong>Oracle</strong><br />
automatically configures the number of recovery slaves (apply processes)<br />
equal to a value that is one less than the number of CPUs in the st<strong>and</strong>by<br />
system. A line in the alert log similar to parallel recovery started with n<br />
processes will be logged after the recovery process has been started. If any<br />
time is recorded for a wait event related to recovery slaves, you must divide<br />
the time by the number of slaves.<br />
• Use the V$RECOVERY_PROGRESS view to get the Total Elapsed Time for<br />
the recovery session. This includes all of the clock time starting from issuing<br />
the RECOVER comm<strong>and</strong> until the session has been ended, either due to<br />
hitting the value specified by using the UNTIL clause when starting recovery<br />
or by canceling recovery.<br />
<strong>Oracle</strong> Active Data Guard: <strong>Oracle</strong> Data Guard 11g Page 31


