Investment strategies for volatile markets
Global Investor, 03/2007 Credit Suisse
Global Investor, 03/2007
Credit Suisse

Create successful ePaper yourself
Turn your PDF publications into a flip-book with our unique Google optimized e-Paper software.
GLOBAL INVESTOR 3.07 19<br />
bottom could indeed achieve stellar returns, as illustrated in Figure 1<br />
which depicts the cumulated gains or losses between peaks and<br />
troughs <strong>for</strong> US equities since 1871.<br />
Believing that bonds have always been a safe asset and always<br />
will be can be misleading indeed. A glance at the per<strong>for</strong>mance of<br />
US government bonds over the past two centuries shows that inflation<br />
has on some occasions seriously dented the real value (i.e.<br />
adjusted <strong>for</strong> the loss of purchasing power resulting from inflation)<br />
of US government bonds.<br />
Asset bubbles and partial predictability of asset returns<br />
It was only during the that the academic world finally came<br />
to realize a fact which many practitioners had long held <strong>for</strong> true.<br />
Anticipating market movements is to some extent possible. <strong>Investment</strong><br />
opportunities and the risk premia offered by asset classes,<br />
such as equities and bonds, vary over time. Markets can be inefficient<br />
at times, more so when investors’ psychological experience<br />
with an asset class has been strongly negative or positive <strong>for</strong> a<br />
number of years. There are times when some assets classes are<br />
or emerging<br />
market equities in 2003<br />
expensive. Technology and Internet stocks in 2000 immediately<br />
come to mind (with the benefit of hindsight, almost everybody now<br />
acknowledges it was a bubble). Investors were understandably<br />
shocked by losing about of their investments in European equities<br />
( in the in Japan and Switzerland) in three<br />
years from peak to trough between 2000 and 2003. Influenced by<br />
the bear market, they overreacted by shifting their portfolios into<br />
fixed income instruments, which resulted in low bond yields and<br />
narrow credit spreads <strong>for</strong> the ensuing three to four years. Equities<br />
were shunned by many investors and penalized with low valuations,<br />
but offered attractive returns <strong>for</strong> precisely this reason, and have<br />
been supported by robust earnings growth ever since.<br />
Asset bubbles and financial market manias are a recurring phenomenon<br />
in financial <strong>markets</strong>. They have happened every six to<br />
seven years over the past 20 years, as investors’ enthusiasm <strong>for</strong> a<br />
new fad tended to carry valuations to excessive levels. In the late<br />
, Japanese real estate and equities reached sky-high valuations<br />
with a price-earnings (P/E) ratio of 60 <strong>for</strong> the Nikkei in<br />
December . The surface of the Imperial Palace in Tokyo was<br />
at this time worth (at least in theory) more than the entire state of<br />
Cali<strong>for</strong>nia and top locations in Tokyo commanded prices fetching<br />
over USD million per square meter. The focus shifted to emerging<br />
Asian countries and their stock <strong>markets</strong>, which reached a P/E<br />
multiple of over 24 in be<strong>for</strong>e collapsing in Investors’<br />
attention then moved on to communication technology and the Internet<br />
in with the Nasdaq index reaching P/E multiples of<br />
over 80 in March 2000. The characteristics of a bubble can be<br />
summarized as follows:<br />
A genuine change in the economic landscape (technological<br />
innovation, the rise of a country as an economic power).<br />
Growing public awareness of this phenomenon through the media.<br />
Uncertainty about how to value the potential of this new opportunity,<br />
which leads to unrealistic valuations at the peak of the bubble<br />
as sentiment gets the upper hand.<br />
Currently, themes drawing strong attention and representing<br />
ground-breaking changes in the geopolitical and economic landscape,<br />
such as energy scarcity/global warming and the rise of<br />
China and India as world economic powers, are the most likely<br />
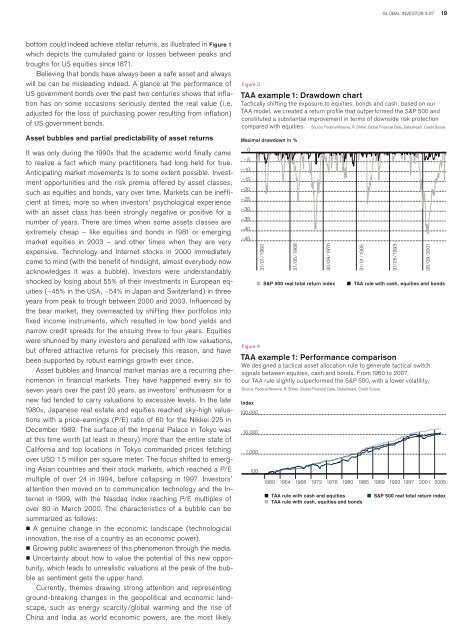
Figure 3<br />
TAA example 1: Drawdown chart<br />
Tactically shifting the exposure to equities, bonds and cash, based on our<br />
TAA model, we created a return profile that outper<strong>for</strong>med the and<br />
constituted a substantial improvement in terms of downside risk protection<br />
compared with equities. Source: Federal Reserve, R. Shiller, Global Financial Data, Datastream, Credit Suisse<br />
<br />
0<br />
–5<br />
–10<br />
–15<br />
–20<br />
–25<br />
–30<br />
–35<br />
–40<br />
–45<br />
Figure 4<br />
31/01/1960<br />
31/05/1968<br />
30/09/1976<br />
<br />
31/01/1985<br />
31/05/1993<br />
28/09/2001<br />
<br />
TAA example 1: Per<strong>for</strong>mance comparison<br />
We designed a tactical asset allocation rule to generate tactical switch<br />
signals between equities, cash and bonds. From to 2007,<br />
our TAA rule slightly outper<strong>for</strong>med the with a lower volatility.<br />
Source: Federal Reserve, R. Shiller, Global Financial Data, Datastream, Credit Suisse<br />
Index<br />
100,000<br />
10,000<br />
1,000<br />
100<br />
1960 1964 1968 1972 1976 1980 1985 1989 1993 1997<br />
2001 2005<br />
TAA rule with cash and equities S&P 500 real total return index<br />
TAA rule with cash, equities and bonds