Investment strategies for volatile markets
Global Investor, 03/2007 Credit Suisse
Global Investor, 03/2007
Credit Suisse

You also want an ePaper? Increase the reach of your titles
YUMPU automatically turns print PDFs into web optimized ePapers that Google loves.
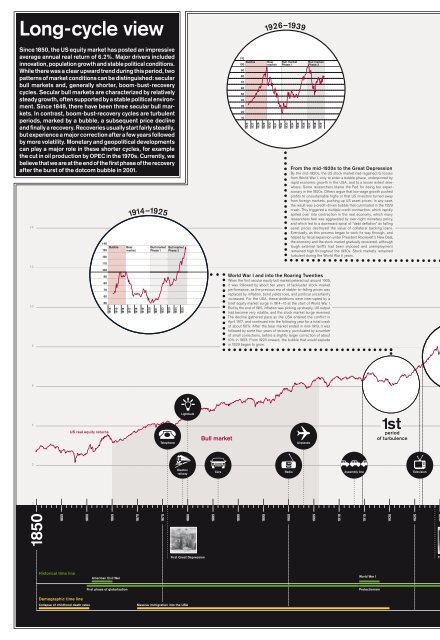
Long-cycle view<br />
1926–1939<br />
1997–2010?<br />
Since 1850, the US equity market has posted an impressive<br />
average annual real return of 6.2%. Major drivers included<br />
innovation, population growth and stable political conditions.<br />
While there was a clear upward trend during this period, two<br />
patterns of market conditions can be distinguished: secular<br />
bull <strong>markets</strong> and, generally shorter, boom-bust-recovery<br />
cycles. Secular bull <strong>markets</strong> are characterized by relatively<br />
steady growth, often supported by a stable political environment.<br />
Since 1849, there have been three secular bull <strong>markets</strong>.<br />
In contrast, boom-bust-recovery cycles are turbulent<br />
periods, marked by a bubble, a subsequent price decline<br />
<br />
but experience a major correction after a few years followed<br />
by more volatility. Monetary and geopolitical developments<br />
can play a major role in these shorter cycles, <strong>for</strong> example<br />
the cut in oil production by OPEC in the 1970s. Currently, we<br />
<br />
after the burst of the dotcom bubble in 2001.<br />
14<br />
140<br />
130<br />
120<br />
Bubble<br />
1914–1925<br />
Bear<br />
market<br />
Bull market<br />
Phase 1<br />
Bull market<br />
Phase 2<br />
110<br />
Bubble<br />
100<br />
90<br />
80<br />
70<br />
60<br />
50<br />
40<br />
30<br />
20<br />
10<br />
1926<br />
1927<br />
1928<br />
Bear<br />
market<br />
1929<br />
1930<br />
1931<br />
Bull market<br />
Phase 1<br />
Bull market<br />
Phase 2<br />
1932<br />
1933<br />
1934<br />
1935<br />
1936<br />
1937<br />
1938<br />
1939<br />
From the mid-1920s to the Great Depression<br />
By the mid-1920s, the US stock market had regained its losses<br />
from World War I, only to enter a bubble phase, underpinned by<br />
rapid economic growth in the USA, and to a lesser extent elsewhere.<br />
Some researchers blame the Fed <strong>for</strong> being too expansionary<br />
in the 1920s. Others argue that low wage growth pushed<br />
profits to unsustainable highs or that US investors turned away<br />
from <strong>for</strong>eign <strong>markets</strong>, pushing up US asset prices. In any case,<br />
the result was a credit-driven bubble that culminated in the 1929<br />
crash. This triggered a multiple credit contraction, which rapidly<br />
spilled over into contraction in the real economy, which many<br />
researchers feel was aggravated by over-tight monetary policy,<br />
and which led to a downward spiral of “debt deflation” as falling<br />
asset prices destroyed the value of collateral backing loans.<br />
Eventually, as this process began to work its way through, and<br />
helped by fiscal expansion under President Roosevelt’s New Deal,<br />
the economy and the stock market gradually recovered, although<br />
tough external tariffs had been imposed and unemployment<br />
remaine d high throughout the 1930s. Stock <strong>markets</strong> remained<br />
turbulent during the World War II years.<br />
120<br />
Bubble<br />
110<br />
100<br />
90<br />
80<br />
70<br />
60<br />
50<br />
40<br />
1970<br />
1971<br />
1972<br />
1970–1983<br />
Bear Bull market<br />
market Phase 1<br />
1973<br />
Bull market<br />
Phase 2<br />
1974<br />
1975<br />
1976<br />
1977<br />
1978<br />
1979<br />
1980<br />
1981<br />
1982<br />
1983<br />
The 1970s and the impact of OPEC<br />
The weakness of stock <strong>markets</strong> in the 1970s was heavily influenced<br />
by the actions of OPEC in pushing up oil prices, especially<br />
the first round in 1973, triggered by events in the Middle<br />
East, but also viewable as a rebalancing of economic power<br />
from oil consumers to producers after 25 years of historically<br />
low, and falling, real oil prices. There were clear monetary errors,<br />
with major inflation triggered by policy being far too expansionary,<br />
perhaps in reaction to being too tight in the early 1930s. This<br />
was eventually corrected with very tough policy under Fed Chairman<br />
Volcker in the USA, which initially caused recession, but<br />
laid the ground <strong>for</strong> the third great secular equity bull market in<br />
the 1980s and 1990s.<br />
110<br />
Bubble<br />
100<br />
90<br />
80<br />
70<br />
60<br />
50<br />
1997<br />
1998<br />
1999<br />
2000<br />
Bear<br />
market<br />
Bull market<br />
Phase 1<br />
Bull market<br />
Phase 2<br />
2001<br />
2002<br />
2003<br />
2004<br />
2005<br />
2006<br />
2007<br />
2008<br />
2009<br />
2010<br />
The dotcom bubble<br />
The dotcom bubble had the typical signs of an investor mania.<br />
Besides dotcom companies that were not valued by their earnings<br />
prospects, but by their cash-burn rates, there were als o cases<br />
of fraud, such as at Enron. The stock market surge was accompanied<br />
by over-investment in the real economy, so that when the<br />
bubble burst, the economy went into recession as companies<br />
had too much capacity. The Fed cut interest rates to very low<br />
levels, which gradually restored demand, allowing the economy<br />
and the stock market to enter a recovery phase. If these events<br />
follow the pattern of previous boom-bust-recovery cycles, this<br />
current recovery would continue <strong>for</strong> several more years, but<br />
would become more <strong>volatile</strong>, perhaps with a large correction<br />
during the next 12 months.<br />
12<br />
10<br />
8<br />
110<br />
100<br />
90<br />
80<br />
70<br />
60<br />
50<br />
1914<br />
1915<br />
1916<br />
1917<br />
1918<br />
1919<br />
1920<br />
1921<br />
1922<br />
1923<br />
1924<br />
1925<br />
<br />
When the first secular equity bull market petered out around 1905,<br />
it was followed by about ten years of lackluster stock-market<br />
per<strong>for</strong>mance, as the previous era of stable-to-falling prices was<br />
replaced by inflation, bond yields rose, and political uncertainty<br />
increased. For the USA, these doldrums were interrupted by a<br />
brief equity market surge in 1914 –15 at the start of World War I.<br />
But by the end of 1915, inflation was picking up sharply, US output<br />
had become very <strong>volatile</strong>, and the stock market surge reversed.<br />
The decline gathered pace as the USA entered the conflict in<br />
April 1917, and continued into the following year <strong>for</strong> a total crash<br />
of about 50%. After the bear market ended in mid-1919, it was<br />
followed by some four years of recovery, punctuated by a number<br />
of small corrections, be<strong>for</strong>e a slightly larger correction of about<br />
10% in 1923. From 1923 onward, the bubble that would explode<br />
in 1929 began to grow.<br />
3rd<br />
period<br />
of turbulence<br />
4th<br />
period<br />
of turbulence<br />
6<br />
4<br />
US real equity returns<br />
Telephone<br />
Lightbulb<br />
Bull market<br />
Airplanes<br />
1st<br />
period<br />
of turbulence<br />
2nd<br />
period<br />
of turbulence<br />
Bull market<br />
Bull market<br />
2<br />
0<br />
1850<br />
1855<br />
Historical time line<br />
Demographic time line<br />
1860<br />
1865<br />
American Civil War<br />
First phase of globalization<br />
1870<br />
1875<br />
Electric<br />
railway<br />
1880<br />
1885<br />
Cars<br />
1890<br />
1895<br />
<br />
1900<br />
1905<br />
1910<br />
Assembly line<br />
1915<br />
World War I<br />
Protectionism<br />
1920<br />
Collapse of childhood death rates Massive immigration into the USA Baby boomers Migration from rural areas into urban areas<br />
Television<br />
1925<br />
1930<br />
1935<br />
1940<br />
First Great Depression The Great Depression Dotcom bubble<br />
World War II<br />
Computer<br />
1945<br />
1950<br />
1955<br />
GATT/WTO (WTO since 1994)<br />
1960<br />
1965<br />
1970<br />
1975<br />
Oil crisis<br />
1980<br />
1985<br />
Internet<br />
1990<br />
Aging societies<br />
1995<br />
2000<br />
2005<br />
2010<br />
09.2007, Source: Credit Suisse, Global Financial Data, Photos: Sheppardsoftware, Library of congress/Prints and Photographs Division, Bernhard Bisson/Corbis Sygma