Japan Real Estate Third Quarter 2012 - RREEF Real Estate
Japan Real Estate Third Quarter 2012 - RREEF Real Estate
Japan Real Estate Third Quarter 2012 - RREEF Real Estate

Create successful ePaper yourself
Turn your PDF publications into a flip-book with our unique Google optimized e-Paper software.
RESEARCH REPORT<br />
<strong>Japan</strong> <strong>Real</strong> <strong>Estate</strong><br />
<strong>Third</strong> <strong>Quarter</strong> <strong>2012</strong><br />
July <strong>2012</strong><br />
<strong>RREEF</strong> <strong>Real</strong> <strong>Estate</strong><br />
www.rreef.com
Prepared By:<br />
Koichiro (Ko) Obu<br />
Director<br />
Head of Research, <strong>Japan</strong> & Korea<br />
+81 (0) 3 5156 6522<br />
koichiro.obu@rreef.com<br />
Mark Roberts<br />
Global Head of Research<br />
+1(212) 454-0974<br />
mark-g.roberts@rreef.com<br />
Table of Contents<br />
<strong>RREEF</strong> REAL ESTATE <strong>Japan</strong> <strong>Real</strong> <strong>Estate</strong> <strong>Third</strong> <strong>Quarter</strong> <strong>2012</strong> | July <strong>2012</strong><br />
Executive Summary ............................................................................ 1<br />
Macro Economy .................................................................................. 2<br />
Capital Market & Pricing ...................................................................... 4<br />
J-REITs ............................................................................................... 8<br />
Market Fundamentals ........................................................................ 10<br />
Office ............................................................................ 10<br />
Retail ............................................................................ 12<br />
Residential .................................................................... 13<br />
Industrial ....................................................................... 15<br />
Past Issues ........................................................................................ 16<br />
Important Notes ................................................................................ 17<br />
Global Research Team ..................................................................... 18
Executive Summary<br />
The outlook for <strong>Japan</strong>’s economic growth in <strong>2012</strong> has improved. Deutsche Bank<br />
economists now expect GDP growth of 3.1 percent this year instead of the 2.8 percent<br />
forecast from just three months ago. With consumer confidence recovering, private<br />
consumption has surprised on the upside. Although most near-term leading indicators<br />
appear encouraging, economic growth is expected to peak in mid <strong>2012</strong>. Waning external<br />
demand from Europe, the United States, and China is likely to contribute to a slowdown in<br />
2013. A planned consumption tax could also hold back growth to some extent in 2014.<br />
<strong>Japan</strong>’s property markets provided mixed signals in the first half of <strong>2012</strong>. On the upside,<br />
J-REITs enjoyed buoyant performance earlier in the year, paving the way for two new<br />
IPOs in the second quarter with more planned for later this year. The volume of asset<br />
purchases by J-REITs reached JPY462.9 billion in the first half of <strong>2012</strong>, an increase of<br />
49.5 percent from the same period in 2011. Limited construction of new logistics space<br />
helped pull the industrial vacancy rate below 2.0 percent in Tokyo and close to full<br />
occupancy in Osaka. Both domestic and foreign buyers have responded to <strong>Japan</strong>’s<br />
industrial market fundamentals, sending transaction volumes up in this sector. Asking<br />
rents in the residential sector held stable across Tokyo’s 23 wards in the second quarter,<br />
with positive upward movement in the five centrally located wards. In the retail sector,<br />
improving consumer sentiment helped pull sales up for shopping centres.<br />
The downside of the property market centres heavily on the office sector. New supply in<br />
Tokyo drove the vacancy rate to an all-time high of 9.4 percent in June, and transaction<br />
volumes in the sector have been limited. Osaka may face a similar disruption to office<br />
fundamentals over the coming year as a wave of new supply is expected to complete in<br />
that market as well. The high-end segment of the residential rental market in Tokyo<br />
softened between the first and second quarters, a general reflection of the outlook for<br />
financial services, a key driver of luxury residential rents.<br />
<strong>RREEF</strong> REAL ESTATE <strong>Japan</strong> <strong>Real</strong> <strong>Estate</strong> <strong>Third</strong> <strong>Quarter</strong> <strong>2012</strong> | July <strong>2012</strong><br />
1
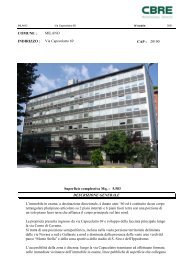
Macro Economy<br />
<strong>Japan</strong>’s GDP growth forecast in <strong>2012</strong> was revised upward to 3.1 percent; an increase<br />
from the 2.8 percent forecast by Deutsche Bank economists in the previous quarter. This<br />
improvement reflects healthier than expected private consumption as well as the<br />
contribution of the latest supplementary budget for reconstruction initiatives by the<br />
government. Economic growth is expected to peak in mid <strong>2012</strong>, however, due to waning<br />
external demand from Europe, the United States, and China. Reconstruction-related<br />
demand is likely to taper gradually in 2013, and the government is planning to increase<br />
the consumption tax rate to 8 percent in April 2014 from the current 5 percent, which is<br />
expected to drag down the growth rate.<br />
<strong>RREEF</strong> REAL ESTATE <strong>Japan</strong> <strong>Real</strong> <strong>Estate</strong> <strong>Third</strong> <strong>Quarter</strong> <strong>2012</strong> | July <strong>2012</strong><br />
4%<br />
2%<br />
0%<br />
-2%<br />
-4%<br />
-6%<br />
-8%<br />
-10%<br />
-12%<br />
Note: F = forecast. Please refer to Important Notes (page 17)<br />
Sources: Deutsche Bank, “<strong>Japan</strong> Economics Weekly”<br />
As of July <strong>2012</strong><br />
Exhibit 1 — GDP Growth Outlook for <strong>Japan</strong><br />
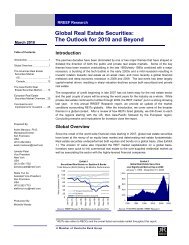
The diffusion index (DI) of the Tankan Survey conducted by the Bank of <strong>Japan</strong> increased<br />
by three points in the second quarter of <strong>2012</strong> from the previous quarter, with stable<br />
momentum expected for the third quarter. The Business Condition Leading Index<br />
calculated by <strong>Japan</strong>’s Cabinet Office also showed positive signals. This reflects firm<br />
private consumption, bolstered by a receding post-quake mood of self-restraint, as well as<br />
the revival of subsidies for eco-friendly cars.<br />
Exhibit 2 — Diffusion Index of Business Conditions<br />
Sources: The Bank of <strong>Japan</strong>, <strong>Japan</strong>’s Cabinet Office, <strong>RREEF</strong> <strong>Real</strong> <strong>Estate</strong><br />
As of July <strong>2012</strong><br />
1995<br />
1996<br />
(2005=100) 119<br />
106<br />
93<br />
80<br />
67<br />
Q1 Q2 Q3 Q4 annual growth<br />
previous financial<br />
crisis in <strong>Japan</strong> (1998)<br />
1991<br />
1997<br />
1998<br />
1999<br />
2000<br />
dot.com bubble burst<br />
2001<br />
2002<br />
2003<br />
2004<br />
global financial<br />
crisis<br />
2005<br />
2006<br />
2007<br />
2008<br />
2009<br />
2010<br />
2011<br />
DB Forecast<br />
Great Tohoku<br />
Earthquake aftermoth<br />
Business Condition Leading Index (LHS) Diffusion Index of Tankan Survey (RHS)<br />
1992<br />
1993<br />
previous financial crisis<br />
in <strong>Japan</strong> (1998)<br />
1994<br />
1995<br />
1996<br />
1997<br />
1998<br />
1999<br />
2000<br />
<strong>2012</strong>F<br />
Diffusion Index of Business Conditions:<br />
('favourable' minus 'unfavourable', % points)<br />
dot.com bubble<br />
burst<br />
2001<br />
2002<br />
2003<br />
2004<br />
2005<br />
global financial<br />
crisis<br />
2006<br />
2007<br />
2008<br />
2009<br />
2010<br />
2011<br />
<strong>2012</strong><br />
2013F<br />
0<br />
2014F<br />
50<br />
25<br />
-25<br />
-50<br />
2015F<br />
2
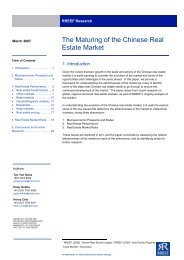
<strong>Japan</strong>’s consumer price index (CPI) increased to 0.4 percent in the first quarter of <strong>2012</strong>,<br />
the highest figure since 2008. A correction in oil and other commodity prices could lead<br />
<strong>Japan</strong>’s CPI back into negative territory in 2013, but prices are set to rise sharply to 2.4<br />
percent in April 2014 due to a planned consumption tax increase. The Bank of <strong>Japan</strong> is<br />
expected to maintain a passive monetary policy stance as political pressure wanes for<br />
further easing.<br />
(%)<br />
<strong>RREEF</strong> REAL ESTATE <strong>Japan</strong> <strong>Real</strong> <strong>Estate</strong> <strong>Third</strong> <strong>Quarter</strong> <strong>2012</strong> | July <strong>2012</strong><br />
2<br />
1<br />
0<br />
-1<br />
-2<br />
-3<br />
2000<br />
Note: F = forecast<br />
Exhibit 3 — Forecast of Short-Term Interest Rate and CPI<br />
Sources: The Bank of <strong>Japan</strong>, <strong>Japan</strong>’s Cabinet Office, <strong>RREEF</strong> <strong>Real</strong> <strong>Estate</strong><br />
As of July <strong>2012</strong><br />
2001<br />
2002<br />
2003<br />
Call Rate (overnight) CPI<br />
2004<br />
2005<br />
2006<br />
2007<br />
2008<br />
2009<br />
2010<br />
2011<br />
<strong>2012</strong>F<br />
Consumption Tax<br />
hike in April 2014<br />
DB Forecast<br />
2013F<br />
2014F<br />
2015F<br />
3
Capital Market & Pricing<br />
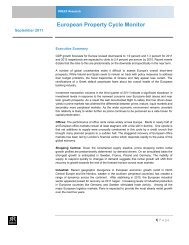
Interest rates remain low, with favourable credit conditions for borrowers expected to<br />
persist. The Bank of <strong>Japan</strong>’s DI for the lending attitudes of banks to the real estate<br />
industry (red line in Exhibit 4) has been positive for five consecutive quarters, and<br />
accordingly, lending to new real estate projects posted positive growth for the past two<br />
consecutive quarters. Concerns are growing, however, in the real estate leasing market<br />
since the office vacancy rate hit an all-time high in June <strong>2012</strong> due to a supply increase<br />
(see page 10).<br />
20%<br />
-20%<br />
-40%<br />
Sources: Bank of <strong>Japan</strong>, <strong>RREEF</strong> <strong>Real</strong> <strong>Estate</strong><br />
As of July <strong>2012</strong><br />
<strong>RREEF</strong> REAL ESTATE <strong>Japan</strong> <strong>Real</strong> <strong>Estate</strong> <strong>Third</strong> <strong>Quarter</strong> <strong>2012</strong> | July <strong>2012</strong><br />
0%<br />
Exhibit 4 — <strong>Real</strong> <strong>Estate</strong> Lending by <strong>Japan</strong>ese Banks<br />
Despite favourable refinancing terms offered by lenders, transaction volume has been in<br />
the doldrums and has fallen below the JPY 2 trillion per year level in recent quarters. The<br />
deal flow is limited especially in the office sector, while domestic and foreign investors<br />
remained active in other sectors.<br />
(JPY tn)<br />
6<br />
5<br />
4<br />
3<br />
2<br />
1<br />
0<br />
Exhibit 5 — <strong>Real</strong> <strong>Estate</strong> Transaction Volume and Lending Attitude DI<br />
Sources: Urban Research Institute, Bank of <strong>Japan</strong>, <strong>Real</strong> Capital Analytics, <strong>RREEF</strong> <strong>Real</strong> <strong>Estate</strong><br />
As of July <strong>2012</strong><br />
2008.03<br />
2008.06<br />
2008.09<br />
2008.12<br />
growth of lending to new projects (yoy, LHS)<br />
lending attitude DI to all industries (RHS)<br />
lending attitude DI to real estate industries (RHS)<br />
2009.03<br />
2009.06<br />
2009.09<br />
2009.12<br />
2010.03<br />
2010.06<br />
transaction volume (12 months, LHS) lending attitude DI (6 months prior, RHS)<br />
2000.09<br />
2001.03<br />
2001.09<br />
2002.03<br />
2002.09<br />
2003.03<br />
2003.09<br />
2004.03<br />
2004.09<br />
2005.03<br />
2005.09<br />
2006.03<br />
2006.09<br />
2007.03<br />
2007.09<br />
2008.03<br />
2008.09<br />
2009.03<br />
2009.09<br />
2010.03<br />
2010.09<br />
2011.03<br />
2011.09<br />
<strong>2012</strong>.03<br />
<strong>2012</strong>.09<br />
2010.09<br />
2010.12<br />
2011.03<br />
2011.06<br />
2011.09<br />
2011.12<br />
<strong>2012</strong>.03<br />
0<br />
20<br />
0<br />
-20<br />
-40<br />
36<br />
24<br />
12<br />
-12<br />
-24<br />
-36<br />
Diffusion Index (DI)<br />
Diffusion Index (DI)<br />
4
Cap rates for assets in Tokyo and Osaka held by J-REITs started to recover in the second<br />
half of 2011 and preliminary numbers point towards continued improvement. The average<br />
cap rate on completed transactions is around 6 percent, the highest level in five years.<br />
This reflects increased activity in high-yielding sectors such as industrial and the decline in<br />
office transactions in Tokyo.<br />
The average yield spread — the difference between the average cap rate of all reported<br />
commercial real estate transactions and government bond yields — held above 500 basis<br />
points in the first quarter of <strong>2012</strong>. <strong>Japan</strong> continues to provide one of the most attractive<br />
spreads among major real estate markets.<br />
7.0%<br />
6.0%<br />
5.0%<br />
4.0%<br />
3.0%<br />
2.0%<br />
<strong>RREEF</strong> REAL ESTATE <strong>Japan</strong> <strong>Real</strong> <strong>Estate</strong> <strong>Third</strong> <strong>Quarter</strong> <strong>2012</strong> | July <strong>2012</strong><br />
Exhibit 6 — Cap Rate (appraisal) and Yield Spread (transacted)<br />
Sources: <strong>Real</strong> Capital Analytics, Bloomberg, <strong>RREEF</strong> <strong>Real</strong> <strong>Estate</strong><br />
As of July <strong>2012</strong><br />
Average Appraisal Cap Rate<br />
for Assets held by J-REITs<br />
Tokyo Office Osaka Office<br />
Tokyo Residential Osaka Residential<br />
<strong>Japan</strong> (transacted)<br />
preliminary<br />
Q1<br />
Q2<br />
Q3<br />
Q4<br />
Q1<br />
Q2<br />
Q3<br />
Q4<br />
Q1<br />
Q2<br />
Q3<br />
Q4<br />
Q1<br />
Q2<br />
Q3<br />
Q4<br />
Q1<br />
Q2<br />
Q3<br />
Q4<br />
Q1<br />
2007 2008 2009 2010 2011 <strong>2012</strong><br />
(bps)<br />
600<br />
500<br />
400<br />
300<br />
200<br />
100<br />
Exhibit 7 shows major real estate transactions either completed or announced since the<br />
beginning of the second quarter of <strong>2012</strong>. Foreign investors and J-REITs remained active.<br />
At least two office deals arose from CMBS defaults during the period, including a sale of<br />
the former headquarter building of Shinsei Bank. While the cumulative amount of<br />
technically defaulted CMBS is estimated to be about JPY1 trillion (US$12 billion) as of the<br />
end of 2011 in <strong>Japan</strong>, most has been retained by debt investors, so distressed sales have<br />
been limited to date.<br />
0<br />
Average Yield Spread for Transactions in<br />
Selected Markets<br />
<strong>Japan</strong> United States<br />
United Kingdom Australia<br />
Singapore Hong Kong<br />
Q1<br />
Q2<br />
Q3<br />
Q4<br />
Q1<br />
Q2<br />
Q3<br />
Q4<br />
Q1<br />
Q2<br />
Q3<br />
Q4<br />
Q1<br />
Q2<br />
Q3<br />
Q4<br />
Q1<br />
Q2<br />
Q3<br />
Q4<br />
Q1<br />
2007 2008 2009 2010 2011 <strong>2012</strong><br />
5
Exhibit 7 — Major Transactions in the First <strong>Quarter</strong> <strong>2012</strong> and Potential Deals<br />
Month Type Asset<br />
Jan-12 retail Zara Fukuoka Tenjin<br />
Notes: est.: estimated, bk: book value, coll: collateral value. Non-office deals, assets outside Tokyo, and acquisitions by foreign managers are highlighted in<br />
yellow. This table is prepared solely for information purposes and not intended to recommend or endorse any specific company's shares or other products.<br />
Sources: <strong>Real</strong> Capital Analytics, Nikkei <strong>Real</strong> <strong>Estate</strong> Market Report, <strong>RREEF</strong> <strong>Real</strong> <strong>Estate</strong><br />
As of July <strong>2012</strong><br />
Tokyo’s volume of commercial real estate transactions in the last 12 months was US$22.6<br />
billion. Tokyo maintained the third position in the global market and the first position in the<br />
Asia Pacific region although the volume of office transactions slipped to fourth place from<br />
the second place in the same period last year.<br />
Exhibit 8.1 — <strong>Real</strong> <strong>Estate</strong> Transaction Volume by City (12 months to June <strong>2012</strong>)<br />
Notes: Commercial real estate transactions exclude non-income producing assets, such as development site transactions<br />
Sources: <strong>Real</strong> Capital Analytics, <strong>RREEF</strong> <strong>Real</strong> <strong>Estate</strong><br />
As of July <strong>2012</strong><br />
<strong>RREEF</strong> REAL ESTATE <strong>Japan</strong> <strong>Real</strong> <strong>Estate</strong> <strong>Third</strong> <strong>Quarter</strong> <strong>2012</strong> | July <strong>2012</strong><br />
Price<br />
(JPY<br />
billio n)<br />
1.5<br />
(mortgage)<br />
Unit<br />
price<br />
(JP Y m<br />
/sum)<br />
Cap<br />
rates<br />
Prefecture<br />
Acquired by<br />
- - Fukuoka Credit Suisse's fund<br />
Investor<br />
origin<br />
Switzerland<br />
Feb-12 retail 3 shopping malls 13.2 - - Tokyo, Osaka CapitaMalls Asia Singapore<br />
Mar-12 hotel Niseko Kogen Hotel - - - Hokkaido Symphony International Hlds UK<br />
Mar-12 office Ginza 4-chome Tower - - - Tokyo MGPA Hong Kong<br />
Apr-12 residential<br />
KDX Daikanyama and Sakaisuji<br />
Honmachi etc. (20 properties)<br />
30 - - diversified<br />
Kenedix Residential REIT (REIT<br />
IPO)<br />
Apr-12 office Meguro Place Tower 3.7 0.8 - Tokyo JV of Aviva and Secured UK/<strong>Japan</strong><br />
Apr-12 office Senri Life Science Center Bldg. 8.1 0.2 8.9% Osaka<br />
Lasalle Investment and Kenedix<br />
<strong>Real</strong>ty (REIT)<br />
US/<strong>Japan</strong><br />
Apr-12 industrial GREEN CUBE est.5.1 - - Osaka Blackstone US<br />
Apr-12 residential Takanawa MOF Lodging 10.0 0.5 Tokyo<br />
Metropolitan Government of<br />
Tokyo<br />
May-12 office Atago Green Hills (20%) 25.6 1.2 4.7% Tokyo Mori Hills REIT <strong>Japan</strong><br />
May-12 office<br />
Roppongi First Bldg (46%) and one<br />
other office bldg.<br />
25.6 1 3.0% Tokyo Mori Building <strong>Japan</strong><br />
May-12 retail Ginza Theatre Bldg 17.9 0.9 - Tokyo a <strong>Japan</strong>ese company <strong>Japan</strong><br />
Jun-12 office/retail<br />
Tokyu Plaza Omotesando, Tokyu<br />
Plaza Akasaka etc. (18 properties)<br />
170 - - diversified<br />
Activia Property REIT sponsored<br />
by Tokyu Land (REIT IPO)<br />
Jun-12 office TIXTOWER UENO 22 0.9 4.8% Tokyo <strong>Japan</strong> <strong>Real</strong> <strong>Estate</strong> (REIT) <strong>Japan</strong><br />
Jun-12 dev. site Chiba retail site (56,208�) 32 - - Chiba Costco group US<br />
Jun-12 dev. site Oiso residential site (9,000�) - - - Kanagawa IPC Corporation Singapore<br />
Jun-12 office etc. 8 properties (CMBS default) est.12 - - Tokyo MGPA's fund Hong Kong<br />
Jun-12 office<br />
Former Shinsei Bank HQ Office<br />
(CMBS default)<br />
est.51 - - Tokyo Kenedix <strong>Japan</strong><br />
Jun-12 retail Aoyama Bell Commons est.10> - - Tokyo Angelo Gordon, Simplex US/<strong>Japan</strong><br />
Jul-12 office NBF Commodio Shiodome 29 1.4 4.8% Tokyo Nippon Building Fund (REIT) <strong>Japan</strong><br />
Jul-12 office Yakuin Business Garden 11.0 0.5 5.6% Fukuoka <strong>Japan</strong> Prime <strong>Real</strong>ty (REIT) <strong>Japan</strong><br />
NYC Metro<br />
London Metro<br />
Tokyo<br />
Paris<br />
DC Metro<br />
LA Metro<br />
SF Metro<br />
Hong Kong<br />
Seoul<br />
Chicago<br />
Singapore<br />
Moscow<br />
Toronto<br />
Houston<br />
Dallas<br />
Sydney<br />
Shanghai<br />
Beijing<br />
Guangzhou<br />
Osaka<br />
Office Retail Apartment Industrial Hotel<br />
($bn)<br />
0 5 10 15 20 25 30 35<br />
<strong>Japan</strong><br />
<strong>Japan</strong><br />
<strong>Japan</strong><br />
6
Below is the commercial real estate transaction volume by sector in <strong>Japan</strong>. The volume of<br />
transactions declined about 26 percent in the first quarter of <strong>2012</strong> from the same period in<br />
the previous year. Limited deal flow in the office sector resulted in three consecutive<br />
quarters of overall decline. Meanwhile, volume increased in the industrial sector during the<br />
period.<br />
Exhibit 8.2 — <strong>Quarter</strong>ly <strong>Real</strong> <strong>Estate</strong> Transaction Volumes by Sector in <strong>Japan</strong><br />
Notes: Commercial real estate transactions exclude non-income producing assets, such as development site transactions<br />
Sources: <strong>Real</strong> Capital Analytics, <strong>RREEF</strong> <strong>Real</strong> <strong>Estate</strong><br />
As of July <strong>2012</strong><br />
Based on the monthly indicator tracked by Investment Property Databank (IPD), the<br />
average annual total return for direct real estate investment on an unlevered basis in<br />
<strong>Japan</strong> improved marginally to 3.7 percent per annum as of February <strong>2012</strong> (the latest<br />
preliminary number available), compared to 3.5 percent in the previous quarter. The<br />
residential sector produced the highest total returns due to the recent cap rate<br />
compression in the sector (see Exhibit 6) as well as the generally stable nature of the<br />
residential rental market (relative to the office sector).<br />
<strong>RREEF</strong> REAL ESTATE <strong>Japan</strong> <strong>Real</strong> <strong>Estate</strong> <strong>Third</strong> <strong>Quarter</strong> <strong>2012</strong> | July <strong>2012</strong><br />
(bn)<br />
20<br />
16<br />
12<br />
8<br />
4<br />
-<br />
-4<br />
-8<br />
15%<br />
10%<br />
5%<br />
0%<br />
-5%<br />
-10%<br />
-15%<br />
Exhibit 9 — <strong>Real</strong> <strong>Estate</strong> Total Returns in <strong>Japan</strong> (unlevered)<br />
Notes: There is a time lag because of raw data being collected through semi-annual reports. Past performance is not indicative of future results<br />
Sources: IPD <strong>Japan</strong> Monthly Indicator, <strong>RREEF</strong> <strong>Real</strong> <strong>Estate</strong><br />
As of July <strong>2012</strong><br />
Q1 Q2 Q3 Q4 Q1 Q2 Q3 Q4 Q1 Q2 Q3 Q4 Q1 Q2 Q3 Q4 Q1 Q2 Q3 Q4 Q1<br />
'07 '08 '09 '10 '11 '12<br />
Total Return Income Return<br />
Capital Growth<br />
(annual total return, all asset classes)<br />
2003<br />
2005<br />
2007<br />
preliminary<br />
2008.06<br />
2008.12<br />
2009.06<br />
2009.12<br />
2010.06<br />
2010.12<br />
2011.06<br />
2011.12<br />
<strong>2012</strong>.02<br />
15%<br />
10%<br />
5%<br />
0%<br />
-5%<br />
-10%<br />
-15%<br />
300%<br />
240%<br />
180%<br />
120%<br />
60%<br />
0%<br />
-60%<br />
-120%<br />
office<br />
retail<br />
residential<br />
industrial<br />
hotel<br />
land/other<br />
growth % (yoy)<br />
Office Retail Residential<br />
2003<br />
2005<br />
2007<br />
(annual total return)<br />
2008.06<br />
2008.12<br />
2009.06<br />
2009.12<br />
2010.06<br />
2010.12<br />
preliminary<br />
2011.06<br />
2011.12<br />
<strong>2012</strong>.02<br />
7
J-REITs<br />
Backed by the Bank of <strong>Japan</strong>’s additional monetary easing in February, the J-REIT index<br />
was buoyant in early <strong>2012</strong>. The index is still exposed to capital market volatility, however,<br />
so it declined along with other equities as the euro crisis deepened in May. Over the<br />
longer time horizon, the recovery of the J-REIT index is substantially lagging compared to<br />
the U.S. and Singaporean REIT markets.<br />
<strong>RREEF</strong> REAL ESTATE <strong>Japan</strong> <strong>Real</strong> <strong>Estate</strong> <strong>Third</strong> <strong>Quarter</strong> <strong>2012</strong> | July <strong>2012</strong><br />
Exhibit 10 — Short Term J-REIT Index and Long Term Global Comparison<br />
J-REIT<br />
Index<br />
1,100 (LHS)<br />
1,000<br />
900<br />
800<br />
2010.09<br />
2010.11<br />
Notes: Past performance is not indicative of future results. Tokyo Stock Exchange REIT Index (J-REIT), FTSE NAREIT All Equity REITS Index (US-REIT),<br />
S&P/ASX 200 A-REIT Index (A-REIT), FTSE ST REIT Index (S-REIT)<br />
Sources: Bloomberg, <strong>RREEF</strong> <strong>Real</strong> <strong>Estate</strong><br />
As of July <strong>2012</strong><br />
On average, the expected J-REIT dividend yield is 5.6 percent overall (and 4.7 percent for<br />
office REITs), providing 460 basis point spreads over the government bond yield. This is<br />
compared with about 200 basis point spreads for U.S.-REITs and UK-REITs.<br />
8%<br />
6%<br />
4%<br />
2%<br />
0%<br />
Exhibit 11 — J-REIT Expected Dividend Yield<br />
Sources: Sumitomo Mitsui Trust Research Institute, Bloomberg, <strong>RREEF</strong> <strong>Real</strong> <strong>Estate</strong><br />
As of July <strong>2012</strong><br />
Great Tohoku<br />
Earthquake<br />
2011.01<br />
2011.03<br />
2011.05<br />
2011.07<br />
2011.09<br />
2011.11<br />
Nikkei 225<br />
(RHS)<br />
<strong>2012</strong>.01<br />
<strong>2012</strong>.03<br />
<strong>2012</strong>.05<br />
<strong>2012</strong>.07<br />
(JPY)<br />
11,000<br />
10,000<br />
9,000<br />
8,000<br />
Following the J-REIT index’s buoyant performance in early <strong>2012</strong>, two new IPOs moved<br />
forward during the second quarter of this year: Kenedix Residential REIT in April and<br />
Activia Properties in June. These were the first J-REIT IPOs in four and half years in<br />
400<br />
350<br />
300<br />
250<br />
200<br />
150<br />
100<br />
50<br />
2003.03<br />
J-REIT US-REIT<br />
A-REIT (Australia) S-REIT (Singapore)<br />
2003.12<br />
2004.09<br />
2005.06<br />
2006.03<br />
(Mar-09 = 100)<br />
J-REIT Office REIT 10Y JGB<br />
2001.09<br />
2001.12<br />
2002.03<br />
2002.06<br />
2002.09<br />
2002.12<br />
2003.03<br />
2003.06<br />
2003.09<br />
2003.12<br />
2004.03<br />
2004.06<br />
2004.09<br />
2004.12<br />
2005.03<br />
2005.06<br />
2005.09<br />
2005.12<br />
2006.03<br />
2006.06<br />
2006.09<br />
2006.12<br />
2007.03<br />
2007.06<br />
2007.09<br />
2007.12<br />
2008.03<br />
2008.06<br />
2008.09<br />
2008.12<br />
2009.03<br />
2009.06<br />
2009.09<br />
2009.12<br />
2010.03<br />
2010.06<br />
2010.09<br />
2010.12<br />
2011.03<br />
2011.06<br />
2011.09<br />
2011.12<br />
<strong>2012</strong>.03<br />
<strong>2012</strong>.06<br />
2006.12<br />
2007.09<br />
2008.06<br />
2009.03<br />
2009.12<br />
2010.09<br />
2011.06<br />
<strong>2012</strong>.03<br />
8
<strong>Japan</strong>, and Activia was the second largest IPO in J-REIT history. There are a couple of<br />
other REITs planning IPOs later this year.<br />
JPY tn<br />
1.0<br />
0.5<br />
0.0<br />
<strong>RREEF</strong> REAL ESTATE <strong>Japan</strong> <strong>Real</strong> <strong>Estate</strong> <strong>Third</strong> <strong>Quarter</strong> <strong>2012</strong> | July <strong>2012</strong><br />
Exhibit 12 — Capital Raising and Transaction by REITs in <strong>Japan</strong><br />
Notes: This table is prepared solely for information purposes and not intended to recommend or endorse any specific company's shares or other products. All<br />
figures provided are based on publicly available documents not DB estimates.<br />
Sources: ARES, Nikkei, <strong>RREEF</strong> <strong>Real</strong> <strong>Estate</strong><br />
As of July <strong>2012</strong><br />
Exhibit 13 shows the share of the acquisition volume by J-REITs out of all the commercial<br />
real estate transactions in <strong>Japan</strong>. The J-REIT’s transactions accounted for 38 percent of<br />
the market in the six months leading to March <strong>2012</strong>, almost the same level as the<br />
previous period and higher than the historical average of 30 percent. The ratio is expected<br />
to increase even more in the next quarter. The volume of asset purchases by J-REITs<br />
was JPY462.9 billion in the first half of the year, including JPY200.7 billion purchased in<br />
conjunction with the new two IPOs. This represented a 49.5 percent increase from the<br />
same period last year.<br />
Exhibit 13 — <strong>Real</strong> <strong>Estate</strong> Transactions in <strong>Japan</strong> and J-REIT share<br />
Sources: ARES, Urban Research Institute, <strong>Real</strong> Capital Analytics, <strong>RREEF</strong> <strong>Real</strong> <strong>Estate</strong><br />
As of July <strong>2012</strong><br />
2001.09<br />
2002.03<br />
2002.09<br />
2003.03<br />
2003.09<br />
2004.03<br />
2004.09<br />
2005.03<br />
2005.09<br />
2006.03<br />
2006.09<br />
2007.03<br />
2007.09<br />
2008.03<br />
2008.09<br />
2009.03<br />
2009.09<br />
2010.03<br />
2010.09<br />
2011.03<br />
2011.09<br />
<strong>2012</strong>.03<br />
<strong>2012</strong>.06<br />
(JPY tn)<br />
3<br />
2<br />
1<br />
0<br />
-1<br />
Bond<br />
3rd Party Allotment<br />
Public Offering<br />
IPO<br />
2000.09<br />
2001.03<br />
2001.09<br />
acquisition by others<br />
acquisition by J-REITs<br />
disposition by J-REITs<br />
2002.03<br />
2002.09<br />
2003.03<br />
2003.09<br />
2004.03<br />
2004.09<br />
net acquisition<br />
by J-REITs<br />
2005.03<br />
2005.09<br />
2006.03<br />
2006.09<br />
2007.03<br />
2007.09<br />
2008.03<br />
Recent Public Offerings (JPY bn)<br />
Name of REIT Month Amount<br />
Kenedix Rresidential Apr-12 13.6<br />
Activia Properties Jun-12 95.4<br />
Total<br />
109.0<br />
Scheduled J-REIT IPOs (JPY bn)<br />
Sponsor (asset type) Month Amount<br />
Aeon (retail) mid <strong>2012</strong> 100.0><br />
GLP (logistic) mid <strong>2012</strong> 125.0<br />
Daiwa House (logistic) late <strong>2012</strong> 90.0<br />
2008.09<br />
2009.03<br />
2009.09<br />
J-REIT share (%) of<br />
all transactions (RHS)<br />
2010.03<br />
2010.09<br />
2011.03<br />
2011.09<br />
<strong>2012</strong>.03<br />
<strong>2012</strong>.06<br />
45%<br />
30%<br />
15%<br />
0%<br />
-15%<br />
9
Market Fundamentals<br />
Office<br />
There were 37 newly completed office buildings in Central Tokyo 1 within the last twelve<br />
months, according to Miki Shoji, and the continuous new supply pushed up the vacancy<br />
rate to all-time high of 9.4 percent in June <strong>2012</strong>. The vacancy rate for newly developed<br />
buildings was especially high, at close to 40 percent. A mild recovery in the vacancy rate<br />
is expected in the second half of the year as the supply level moderates.<br />
<strong>RREEF</strong> REAL ESTATE <strong>Japan</strong> <strong>Real</strong> <strong>Estate</strong> <strong>Third</strong> <strong>Quarter</strong> <strong>2012</strong> | July <strong>2012</strong><br />
Exhibit 14 — Office Vacancy Rate in Central Tokyo (5 wards)<br />
Sources: Miki Shoji, <strong>RREEF</strong> <strong>Real</strong> <strong>Estate</strong><br />
As of July <strong>2012</strong><br />
Because of the increase in new supply, the vacancy rate for larger assets rose from 5.8<br />
percent to 6.6 percent in June <strong>2012</strong>. This remains a much lower vacancy rate than for<br />
smaller buildings, as demand is stronger for larger, newer, and higher quality spaces.<br />
Exhibit 15 — Office Vacancy Rate in Central Tokyo by Building Floor Plate Size<br />
12%<br />
8%<br />
4%<br />
0%<br />
Vacancy rate for all buildings<br />
Sources: Sanko <strong>Estate</strong>, <strong>RREEF</strong> <strong>Real</strong> <strong>Estate</strong><br />
As of July <strong>2012</strong><br />
20 %<br />
15 %<br />
10 %<br />
5 %<br />
0 %<br />
2002<br />
2003<br />
all buildings (LHS) new buildings (RHS)<br />
2004<br />
1 Central Tokyo is defined as the central five wards of Chiyoda, Chuo, Minato, Shinjuku, and Shibuya.<br />
2005<br />
2006<br />
2007<br />
2008<br />
2009<br />
2010<br />
2011<br />
<strong>2012</strong><br />
Forecast<br />
40 %<br />
30 %<br />
20 %<br />
10 %<br />
floor plate : 165 sqm - 330sqm floor plate : 330 sqm - 660 sqm<br />
floor plate > 660 sqm<br />
1996.03<br />
1996.09<br />
1997.03<br />
1997.09<br />
1998.03<br />
1998.09<br />
1999.03<br />
1999.09<br />
2000.03<br />
2000.09<br />
2001.03<br />
2001.09<br />
2002.03<br />
2002.09<br />
2003.03<br />
2003.09<br />
2004.03<br />
2004.09<br />
2005.03<br />
2005.09<br />
2006.03<br />
2006.09<br />
2007.03<br />
2007.09<br />
2008.03<br />
2008.09<br />
2009.03<br />
2009.09<br />
2010.03<br />
2010.09<br />
2011.03<br />
2011.09<br />
<strong>2012</strong>.03<br />
<strong>2012</strong>.09<br />
0 %<br />
newly developed buildings<br />
10
Office rental growth rates correlate inversely to the vacancy rate. Historically in Tokyo,<br />
office rents start to increase when the vacancy rate falls below 5 percent, so as vacancy<br />
rates for buildings with floor plates of 660 square meters or over moved up to 6.6 percent<br />
in Tokyo, the corresponding rents declined accordingly.<br />
Exhibit 16 — Vacancy Rate and Rent Growth in Tokyo (floor plate < 660 sqm)<br />
Sources: Sanko <strong>Estate</strong>, NLI Research Institute, <strong>RREEF</strong> <strong>Real</strong> <strong>Estate</strong><br />
As of July <strong>2012</strong><br />
Due to the record high vacancy rate and continuous supply of new spaces, office rents in<br />
Tokyo are still falling modestly for most building classes. Rents for average quality<br />
benchmark buildings are not expected to stabilise until 2013.<br />
Exhibit 17 — Office Asking Rent in Central Tokyo by Building Floor Plate Size<br />
Notes: F = forecast. The tsubo is a traditional measure of floor area in <strong>Japan</strong>. It is equivalent to 3.3 square metres (35.6 square feet)<br />
Sources: Miki Shoji, Sanko <strong>Estate</strong>, <strong>RREEF</strong> <strong>Real</strong> <strong>Estate</strong><br />
As of July <strong>2012</strong><br />
<strong>RREEF</strong> REAL ESTATE <strong>Japan</strong> <strong>Real</strong> <strong>Estate</strong> <strong>Third</strong> <strong>Quarter</strong> <strong>2012</strong> | July <strong>2012</strong><br />
8%<br />
4%<br />
0%<br />
-4%<br />
-8%<br />
-12%<br />
Actual Rent Growth (QoQ, 3Q rolling avg.) Vacancy Rate (RHS)<br />
1994.12<br />
1995.06<br />
1995.12<br />
1996.06<br />
1996.12<br />
1997.06<br />
1997.12<br />
1998.06<br />
1998.12<br />
1999.06<br />
1999.12<br />
2000.06<br />
2000.12<br />
2001.06<br />
2001.12<br />
2002.06<br />
2002.12<br />
2003.06<br />
2003.12<br />
2004.06<br />
2004.12<br />
2005.06<br />
2005.12<br />
2006.06<br />
2006.12<br />
2007.06<br />
2007.12<br />
2008.06<br />
2008.12<br />
2009.06<br />
2009.12<br />
2010.06<br />
2010.12<br />
2011.06<br />
2011.12<br />
<strong>2012</strong>.06<br />
(JPY/tsubo*/mon) (USD/sqf/year)<br />
50,000<br />
40,000<br />
30,000<br />
20,000<br />
10,000<br />
floor plate < 165 sqm<br />
Prime<br />
Buildings in CBD<br />
floor plate > 660 sqm<br />
Benchmark<br />
floor plate > 330 sqm<br />
Newly built buildings<br />
floor plate > 330 sqm<br />
floor plate > 165 sqm<br />
1994<br />
1995<br />
1996<br />
1997<br />
1998<br />
1999<br />
2000<br />
2001<br />
2002<br />
2003<br />
2004<br />
2005<br />
2006<br />
2007<br />
2008.03<br />
2008.06<br />
2008.09<br />
2008.12<br />
2009.03<br />
2009.06<br />
2009.09<br />
2009.12<br />
2010.03<br />
2010.06<br />
2010.09<br />
2010.12<br />
2011.03<br />
2011.06<br />
2011.09<br />
2011.12<br />
2011.03<br />
<strong>2012</strong>.06<br />
1%<br />
3%<br />
5%<br />
7%<br />
9%<br />
11%<br />
182<br />
<strong>RREEF</strong> Forecast<br />
<strong>2012</strong>.12F<br />
145<br />
109<br />
73<br />
11
Office vacancy rates peaked in major regional cities in <strong>Japan</strong> in 2009 and have been in a<br />
mild recovery trend since then. Contrary to Tokyo, new office supply has been limited in<br />
these cities. In Osaka, for example, the vacancy rate declined to 10.1 percent in June<br />
<strong>2012</strong>, but this may be a short-lived trend. Osaka’s vacancy rate is likely to rise again<br />
within the coming year as some large new completions are expected, including<br />
Nakanoshima Festival Tower (completion planned in October <strong>2012</strong>, GFA 2 146,000sqm),<br />
Daibiru Honkan (February 2013, GFA 48,000sqm) and Grand Front Osaka A/B (March<br />
2013, NRA 3 236,800sqm).<br />
<strong>RREEF</strong> REAL ESTATE <strong>Japan</strong> <strong>Real</strong> <strong>Estate</strong> <strong>Third</strong> <strong>Quarter</strong> <strong>2012</strong> | July <strong>2012</strong><br />
Exhibit 18 — Office Vacancy Rates in Major Cities in <strong>Japan</strong> (all grades)<br />
(%)<br />
16<br />
14<br />
12<br />
10<br />
8<br />
6<br />
4<br />
2<br />
Sources: Miki Shoji, <strong>RREEF</strong> <strong>Real</strong> <strong>Estate</strong><br />
As of July <strong>2012</strong><br />
Retail<br />
The average asking retail rents for major high streets in Tokyo showed resilience in early<br />
<strong>2012</strong>. Rents are largely stable in most sub markets for the last two quarters, if not<br />
recovering. The number of foreign tourists to <strong>Japan</strong> fell only by 4 percent in the three-<br />
month period ending in May, compared to the same period two years ago (before the<br />
earthquake). High street rents are expected to remain flat throughout this year.<br />
Exhibit 19 — Average High Street Retail Asking Rents in Tokyo and Osaka<br />
Sources: Attractors Lab, Miki Shoji, <strong>RREEF</strong> <strong>Real</strong> <strong>Estate</strong><br />
As of July <strong>2012</strong><br />
1997<br />
2 GFA = gross floor area<br />
3 NRA = net rentable area<br />
1998<br />
(JPY/tsubo/mon)<br />
50,000<br />
40,000<br />
30,000<br />
20,000<br />
10,000<br />
Sapporo Fukuoka Nagoya Osaka Tokyo<br />
1999<br />
2000<br />
2001<br />
2002<br />
2003<br />
2004<br />
2005<br />
2006<br />
Ginza Omotesando Shinjuku<br />
Shibuya Shinsaibashi Office (Central Tokyo)<br />
2008.03<br />
2008.06<br />
2008.09<br />
2008.12<br />
2009.03<br />
2009.06<br />
2009.09<br />
2009.12<br />
2010.03<br />
2007<br />
2010.06<br />
2008<br />
2010.09<br />
2009<br />
2010.12<br />
2010<br />
2011.03<br />
2011<br />
2011.06<br />
<strong>2012</strong>.03<br />
2011.09<br />
<strong>2012</strong>.06<br />
2011.12<br />
<strong>2012</strong>.03<br />
12
Retail sales in the properties with large-scale formats remained firm in April and May<br />
<strong>2012</strong>. Sales at shopping centres and department stores increased by 0.4 percent and 0.2<br />
percent respectively in the period (on an existing store basis) over last year. Sales are<br />
expected to stabilise towards the end of the year.<br />
-5%<br />
-10%<br />
-15%<br />
<strong>RREEF</strong> REAL ESTATE <strong>Japan</strong> <strong>Real</strong> <strong>Estate</strong> <strong>Third</strong> <strong>Quarter</strong> <strong>2012</strong> | July <strong>2012</strong><br />
5%<br />
0%<br />
Exhibit 20 — Retail Sales Growth in <strong>Japan</strong> (year on year)<br />
Sources: JCSC, JDSA, JCSA, <strong>RREEF</strong> <strong>Real</strong> <strong>Estate</strong><br />
As of July <strong>2012</strong><br />
Residential<br />
The average sales price per unit for new built-for-sale condos in Greater Tokyo has been<br />
flat at around JPY 45 to 46 million for the last three quarters. This reflects softer demand<br />
after the initial rush to take advantage of an extended mortgage tax break implemented in<br />
2009. The contract rate 4 (orange line in Chart 21) stood at 78.7 percent in April/May <strong>2012</strong>,<br />
well above the threshold 70 percent level which is associated with healthy market<br />
conditions. We expect a mild recovery in condo prices in the latter half of the year in<br />
accordance with the recent recovery in consumer sentiment.<br />
Exhibit 21 — Newly-built Condo Unit Price and Contract Rate in Greater Tokyo<br />
Sources: REEI, <strong>RREEF</strong> <strong>Real</strong> <strong>Estate</strong><br />
As of July <strong>2012</strong><br />
2000<br />
2001<br />
2002<br />
2003<br />
2004<br />
2005<br />
2006<br />
2007<br />
2008.03<br />
2008.06<br />
2008.09<br />
2008.12<br />
2009.03<br />
2009.06<br />
2009.09<br />
2009.12<br />
2010.03<br />
2010.06<br />
2010.09<br />
2010.12<br />
2011.03<br />
2011.06<br />
2011.09<br />
2011.12<br />
<strong>2012</strong>.03<br />
<strong>2012</strong>.05<br />
50<br />
45<br />
40<br />
35<br />
Shopping Centre Department Store Chain Store<br />
(for existing stores for all categories)<br />
4 The contract rate is the ratio of units contracted (sold) to the number of units delivered for sale.<br />
Avg. unit price (LHS) Contract rate (RHS)<br />
(JPY mn/unit) (%)<br />
1995<br />
1996<br />
1997<br />
1998<br />
1999<br />
2000<br />
2001<br />
2002<br />
2003<br />
2004<br />
2005<br />
2006<br />
2007.03<br />
2007.06<br />
2007.09<br />
2007.12<br />
2008.03<br />
2008.06<br />
2008.09<br />
2008.12<br />
2009.03<br />
2009.06<br />
2009.09<br />
2009.12<br />
2010.03<br />
2010.06<br />
2010.09<br />
2010.12<br />
2011.03<br />
2011.06<br />
2011.09<br />
2011.12<br />
<strong>2012</strong>.03<br />
<strong>2012</strong>.05<br />
80<br />
70<br />
60<br />
50<br />
13
Because of the limited development of new residential rental units in Tokyo in the last two<br />
years, the vacancy rate has recovered and is now approaching its long-term average of<br />
10 percent for all assets in the 23-ward area, and below 4 percent for assets held by J-<br />
REITs. Asking rents show positive year-on-year growth in the central 5-ward area (blue<br />
bar in Exhibit 22), especially in the popular locations of Shibuya and Minato, while they<br />
remained level in the broader 23-ward area of Tokyo.<br />
(Index)<br />
109<br />
<strong>RREEF</strong> REAL ESTATE <strong>Japan</strong> <strong>Real</strong> <strong>Estate</strong> <strong>Third</strong> <strong>Quarter</strong> <strong>2012</strong> | July <strong>2012</strong><br />
106<br />
103<br />
100<br />
97<br />
Exhibit 22 — Residential Rent and Vacancy in Tokyo<br />
Notes: The tsubo is a traditional measure of floor area in <strong>Japan</strong>. It is equivalent to 3.3 square metres (35.6 square feet)<br />
Sources: TAS Corporation with data sourced from At Home Co. Ltd. (23-ward vacancy), Leasing Management Consulting (5-ward asking rent), IPD-RECRUIT<br />
Residential Index (23-ward rent index)<br />
As of July <strong>2012</strong><br />
The high-end residential market correlates closely with the office leasing market. This<br />
high-end segment of the market is strongly affected by business conditions of the<br />
corporate sector, especially the financial services. The vacancy rate of high-end<br />
apartments in Tokyo was 9.1 percent in the second quarter of <strong>2012</strong>, while average high-<br />
end residential rents declined by 1.6 percent from the previous quarter. The financial<br />
sector, still weak from recession, signals the potential for a further mild decline in high-end<br />
residential rents this year.<br />
Exhibit 23 — High-end Residential Rent and Vacancy Rate in Tokyo<br />
Sources: Ken <strong>Real</strong> <strong>Estate</strong> Investment Advisors Ltd., Miki Shoji, <strong>RREEF</strong> <strong>Real</strong> <strong>Estate</strong><br />
As of July <strong>2012</strong><br />
(JPY/tsubo)<br />
14,600<br />
14,200<br />
13,800<br />
13,400<br />
13,000<br />
23 ward Rent Index<br />
5 ward Asking Rent<br />
23 ward Vacancy (RHS)<br />
Vacancy at REIT (RHS)<br />
2005.03<br />
2005.06<br />
2005.09<br />
2005.12<br />
2006.03<br />
2006.06<br />
2006.09<br />
2006.12<br />
2007.03<br />
2007.06<br />
2007.09<br />
2007.12<br />
2008.03<br />
2008.06<br />
2008.09<br />
2008.12<br />
2009.03<br />
2009.06<br />
2009.09<br />
2009.12<br />
2010.03<br />
2010.04<br />
2010.05<br />
2010.06<br />
2010.07<br />
2010.08<br />
2010.09<br />
2010.10<br />
2010.11<br />
2010.12<br />
2011.01<br />
2011.02<br />
2011.03<br />
2011.04<br />
2011.05<br />
2011.06<br />
2011.07<br />
2011.08<br />
2011.09<br />
2011.10<br />
2011.11<br />
2011.12<br />
<strong>2012</strong>.01<br />
<strong>2012</strong>.02<br />
<strong>2012</strong>.03<br />
<strong>2012</strong>.04<br />
<strong>2012</strong>.05<br />
<strong>2012</strong>.06<br />
office rent high end residential rent<br />
(Yen/tsubo/month) (%)<br />
office vacancy high end residential vacancy<br />
25,000<br />
15<br />
22,000<br />
19,000<br />
16,000<br />
13,000<br />
10,000<br />
7,000<br />
1999<br />
2000<br />
2001<br />
2002<br />
2003<br />
2004<br />
2005<br />
2006<br />
Annually<br />
2007<br />
<strong>Quarter</strong>ly<br />
2008.03<br />
2008.06<br />
2008.09<br />
2008.12<br />
2009.03<br />
2009.06<br />
2009.09<br />
2009.12<br />
2010.03<br />
2010.06<br />
2010.09<br />
2010.12<br />
2011.03<br />
2011.06<br />
2011.09<br />
2011.12<br />
<strong>2012</strong>.03<br />
<strong>2012</strong>.06<br />
12<br />
9<br />
6<br />
3<br />
0<br />
(%)<br />
11<br />
9<br />
7<br />
5<br />
3<br />
14
Industrial<br />
In the last two and half years, the volume of new supply was limited to one third of the<br />
space supplied in the peak years (2007 to 2008). As a result, vacancy rates for industrial<br />
assets tightened to 1.9 percent in Greater Tokyo and to as low as 0.2 percent in Greater<br />
Osaka in the first quarter of <strong>2012</strong>. The defensive nature of these assets attracted<br />
domestic and foreign investors (see Exhibit 8.2). The volume of new completions will be<br />
about 50 percent above the long-term average of 600,000 square meters per annum in<br />
Greater Tokyo in <strong>2012</strong> and 2013, and the vacancy rate is expected to increase mildly in<br />
the medium term in both cities.<br />
20%<br />
15%<br />
10%<br />
<strong>RREEF</strong> REAL ESTATE <strong>Japan</strong> <strong>Real</strong> <strong>Estate</strong> <strong>Third</strong> <strong>Quarter</strong> <strong>2012</strong> | July <strong>2012</strong><br />
5%<br />
0%<br />
Exhibit 24 — Vacancy Rate of Multi-tenant Logistics<br />
Sources: Ichigo <strong>Real</strong> <strong>Estate</strong> Service, <strong>RREEF</strong> <strong>Real</strong> <strong>Estate</strong><br />
As of July <strong>2012</strong><br />
Given the limited availability of space, rents for logistics assets are still holding steady in<br />
Greater Tokyo and Greater Osaka, having moved little in the last 12 months. Despite<br />
favourable supply fundamentals, the outlook for rental growth will be limited in the<br />
foreseeable future as retailers and manufacturers, the main tenant industries, face their<br />
own cost-cutting pressures.<br />
Exhibit 25 — Logistics Rent in Greater Tokyo and Greater Osaka<br />
Sources: Ichigo <strong>Real</strong> <strong>Estate</strong> Service, <strong>RREEF</strong> <strong>Real</strong> <strong>Estate</strong><br />
As of July <strong>2012</strong><br />
2008.06<br />
2008.09<br />
(JPY/month/tsubo)<br />
5,000<br />
4,000<br />
3,000<br />
2,000<br />
1,000<br />
0<br />
2008.03<br />
2008.12<br />
2008.06<br />
2009.03<br />
2008.09<br />
Greater Tokyo Greater Osaka<br />
2008.12<br />
2009.06<br />
2009.03<br />
2009.09<br />
2009.06<br />
2009.12<br />
2010.03<br />
2010.06<br />
2010.09<br />
2010.12<br />
2011.03<br />
2011.06<br />
2011.09<br />
2011.12<br />
forecast by Ichigo<br />
<strong>2012</strong>.03<br />
Greater Tokyo Greater Osaka<br />
2009.09<br />
2009.12<br />
2010.03<br />
2010.06<br />
2010.09<br />
2010.12<br />
2011.03<br />
2011.06<br />
2011.09<br />
2011.12<br />
<strong>2012</strong>.03<br />
<strong>2012</strong>.12<br />
<strong>2012</strong>.12<br />
2013.12<br />
forecast by Ichigo<br />
2013.12<br />
15
Past Issues<br />
<strong>RREEF</strong> REAL ESTATE <strong>Japan</strong> <strong>Real</strong> <strong>Estate</strong> <strong>Third</strong> <strong>Quarter</strong> <strong>2012</strong> | July <strong>2012</strong><br />
Vol Year Publication Research Topic<br />
1<br />
Second <strong>Quarter</strong> Jun 08<br />
Making sense of the rental market in<br />
<strong>Japan</strong><br />
2 2008 <strong>Third</strong> <strong>Quarter</strong> Sep 08 Impact of the credit crunch<br />
3 Fourth <strong>Quarter</strong> Dec 08 Revitalisation of ailing J-REITs<br />
4<br />
2009<br />
First <strong>Quarter</strong> Mar 09 Tokyo office market in its global context<br />
5 Second <strong>Quarter</strong> Jul 09 <strong>Japan</strong> residential market<br />
6 <strong>Third</strong> <strong>Quarter</strong> Oct 09<br />
7 Fourth <strong>Quarter</strong> Jan 10<br />
8<br />
2010<br />
History repeats itself? A comparison of<br />
the ‘Year 2003 Problem’ with 2009<br />
Introducing unit pricing analysis in<br />
<strong>Japan</strong><br />
First <strong>Quarter</strong> Apr 10 Portfolio optimisation analysis in <strong>Japan</strong><br />
9 Second <strong>Quarter</strong> Jul 10<br />
10 <strong>Third</strong> <strong>Quarter</strong> Oct 10 <strong>Quarter</strong>ly Report<br />
11 Fourth <strong>Quarter</strong> Jan 11<br />
12<br />
First <strong>Quarter</strong> Apr 11<br />
2011<br />
13 Second <strong>Quarter</strong> Jul 11<br />
14 <strong>Third</strong> <strong>Quarter</strong> Oct 11 <strong>Quarter</strong>ly Report<br />
15<br />
16 <strong>2012</strong> Second <strong>Quarter</strong> Apr 12 <strong>Quarter</strong>ly Report<br />
<strong>Japan</strong>’s capital market in a global<br />
context<br />
Cross-border investment into and out of<br />
<strong>Japan</strong><br />
The Great Tohoku Earthquake and its<br />
impact on the <strong>Japan</strong>ese real estate<br />
market<br />
Adapting <strong>Japan</strong>’s land price index for<br />
real estate analysis<br />
First <strong>Quarter</strong> Jan 12 The J-REITs next 10 years<br />
17 <strong>Third</strong> <strong>Quarter</strong> Jul 12 <strong>Quarter</strong>ly Report<br />
16
Important Notes<br />
<strong>RREEF</strong> REAL ESTATE <strong>Japan</strong> <strong>Real</strong> <strong>Estate</strong> <strong>Third</strong> <strong>Quarter</strong> <strong>2012</strong> | July <strong>2012</strong><br />
Copyright © <strong>2012</strong> Deutsche Bank AG, Frankfurt am Main. All rights reserved. <strong>RREEF</strong> is the<br />
brand name of the real estate division for the asset management activities of Deutsche Bank AG.<br />
In the US this relates to the asset management activities of <strong>RREEF</strong> America L.L.C.; in Germany:<br />
<strong>RREEF</strong> Investment GmbH, <strong>RREEF</strong> Management GmbH, and <strong>RREEF</strong> Spezial Invest GmbH; in<br />
Australia: Deutsche Asset Management (Australia) Limited (ABN 63 116 232 154) Australian<br />
financial services license holder; in <strong>Japan</strong>: Deutsche Securities Inc.*; in Hong Kong: Deutsche<br />
Bank Aktiengesellschaft, Hong Kong Branch (for Direct <strong>Real</strong> <strong>Estate</strong> business), and Deutsche<br />
Asset Management Hong Kong (for <strong>Real</strong> <strong>Estate</strong> Securities Business); in Singapore: Deutsche<br />
Asset Management (Asia) Limited (Company Reg. No. 198701485N); and in the United<br />
Kingdom: Deutsche Alternative Asset Management (UK) Limited, Deutsche Alternative Asset<br />
Management (Global) Limited, and Deutsche Asset Management (UK) Limited; and in Denmark,<br />
Finland, Norway and Sweden: Deutsche Alternative Asset Management (UK) Ltd and Deutsche<br />
Alternative Asset Management (Global) Ltd; in addition to other regional entities in the Deutsche<br />
Bank Group. (*) For DSI, financial advisory, investment advisory, and distribution services only.<br />
Key <strong>RREEF</strong> research personnel are voting members of various <strong>RREEF</strong> investment committees.<br />
Members of the investment committees vote with respect to underlying investments and/or<br />
transactions and certain other matters subjected to a vote of such investment committee.<br />
Additionally, research personnel receive, and may in the future receive incentive compensation<br />
based on the performance of a certain investment accounts and investment vehicles managed<br />
by <strong>RREEF</strong> and its affiliates.<br />
This material is intended for informational purposes only and it is not intended that it be relied on<br />
to make any investment decision. It does not constitute investment advice or a recommendation<br />
or an offer or solicitation and is not the basis for any contract to purchase or sell any security or<br />
other instrument, or for Deutsche Bank AG and its affiliates to enter into or arrange any type of<br />
transaction as a consequence of any information contained herein. Neither Deutsche Bank AG<br />
nor any of its affiliates gives any warranty as to the accuracy, reliability or completeness of<br />
information which is contained in this document. Except insofar as liability under any statute<br />
cannot be excluded, no member of the Deutsche Bank Group, the Issuer or any officer,<br />
employee or associate of them accepts any liability (whether arising in contract, in tort or<br />
negligence or otherwise) for any error or omission in this document or for any resulting loss or<br />
damage whether direct, indirect, consequential or otherwise suffered by the recipient of this<br />
document or any other person.<br />
The views expressed in this document constitute Deutsche Bank AG or its affiliates’ judgment at<br />
the time of issue and are subject to change. This document is only for professional investors.<br />
This document was prepared without regard to the specific objectives, financial situation or<br />
needs of any particular person who may receive it. No further distribution is allowed without prior<br />
written consent of the Issuer.<br />
An investment in real estate involves a high degree of risk and is suitable only for sophisticated<br />
investors who can bear substantial investment losses. The value of shares/units and their<br />
derived income may fall as well as rise. Past performance or any prediction or forecast is not<br />
indicative of future results.<br />
The forecasts provided are based upon our opinion of the market as at this date and are subject<br />
to change, dependent on future changes in the market. Any prediction, projection or forecast on<br />
the economy, stock market, bond market or the economic trends of the markets is not<br />
necessarily indicative of the future or likely performance.<br />
17
Office Locations:<br />
Frankfurt<br />
Mainzer Landstraße 178-190<br />
60327 Frankfurt am Main<br />
Germany<br />
Tel: +49 69 71704 0<br />
London<br />
One Appold Street<br />
London EC2A 2UU<br />
United Kingdom<br />
Tel: +44 20 754 58000<br />
New York<br />
345 Park Avenue<br />
24th Floor<br />
New York<br />
NY 10154-0102<br />
United States<br />
Tel:+1 212 454 6260<br />
Paris<br />
Floor 4<br />
3 Avenue de Friedland<br />
Paris<br />
France<br />
Tel: +33 1 44 95 63 80<br />
San Francisco<br />
101 California Street<br />
26th Floor<br />
San Francisco<br />
CA 94111<br />
United States<br />
Tel:+1 415 781 3300<br />
Singapore<br />
One Raffles Quay<br />
South Tower<br />
048583 Singapore<br />
Tel: +65 6423 8385<br />
Tokyo<br />
Floor 17<br />
Sanno Park Tower<br />
2-11-1 Nagata-cho<br />
Chiyoda-Ku<br />
Tokyo<br />
<strong>Japan</strong><br />
Tel:+81 3 5156 6000<br />
Global Research Team<br />
Global<br />
Mark Roberts<br />
Global Head of Research<br />
mark-g.roberts@rreef.com<br />
Americas<br />
Marc Feliciano<br />
Chief Investment Officer, Americas<br />
marc.feliciano@rreef.com<br />
Ross Adams<br />
Industrial Specialist<br />
ross.adams@rreef.com<br />
Bill Hersler<br />
Office Specialist<br />
bill.hersler@rreef.com<br />
Ana Leon<br />
Property Market Research<br />
ana.leon@rreef.com<br />
Europe<br />
Simon Durkin<br />
Head of Research, Europe<br />
simon.durkin@rreef.com<br />
Gianluca Muzzi<br />
Chief Investment Officer, Europe<br />
gianluca.muzzi@rreef.com<br />
Jaroslaw Morawski<br />
Property Market Research<br />
jaroslaw.morawski@rreef.com<br />
Nazanin Nobahar<br />
Property Market Research<br />
nazanin.nobahar@rreef.com<br />
Asia Pacific<br />
Leslie Chua<br />
Head of Research, Asia Pacific ex-<strong>Japan</strong>/Korea<br />
leslie.chua@rreef.com<br />
Koichiro Obu<br />
Head of Research, <strong>Japan</strong>/Korea<br />
koichiro.obu@rreef.com<br />
Kurt W Roeloffs<br />
Global Chief Investment Officer<br />
kurt.w.roeloffs@rreef.com<br />
Andrew J. Nelson<br />
Retail Specialist<br />
andrewj.nelson@rreef.com<br />
Alex Symes<br />
Economic & Quantitative Analysis<br />
alex.symes@rreef.com<br />
Brooks Wells<br />
Apartment Specialist<br />
brooks.wells@rreef.com<br />
Arezou Said<br />
Property Market Research<br />
arezou.said@rreef.com<br />
Maren Vaeth<br />
Property Market Research<br />
maren.vaeth@rreef.com<br />
Simon Wallace<br />
Property Market Research<br />
simon.wallace@rreef.com<br />
Natasha Lee<br />
Property Market Research<br />
natasha-j.lee@rreef.com<br />
www.rreef.com<br />
I-028630-1.0