

Latino and Hispanic Youth in the Juvenile Justice System
Latino and Hispanic Youth in the Juvenile Justice System
Latino and Hispanic Youth in the Juvenile Justice System

Create successful ePaper yourself
Turn your PDF publications into a flip-book with our unique Google optimized e-Paper software.
Racial disparities occur at various decision po<strong>in</strong>ts<br />
with<strong>in</strong> <strong>the</strong> juvenile justice system<br />
The RRI measures<br />
disparity at each<br />
decision po<strong>in</strong>t<br />
OJJDP developed <strong>the</strong> Relative Rate Index<br />
(RRI) as a tool to identify <strong>and</strong> measure<br />
disparities across <strong>the</strong> stages of <strong>the</strong> juvenile<br />
justice system by compar<strong>in</strong>g rates of<br />
juvenile justice contact experienced by different<br />
groups of youth. The RRI takes <strong>the</strong><br />
relative size of different populations at<br />
each stage of <strong>the</strong> process <strong>and</strong> compares<br />
it to <strong>the</strong> immediately preced<strong>in</strong>g stage for<br />
each group. The key idea beh<strong>in</strong>d <strong>the</strong> RRI<br />
is to quantify <strong>the</strong> nature of <strong>the</strong> decisions<br />
at each decision po<strong>in</strong>t (i.e., rate) for each<br />
group <strong>and</strong> <strong>the</strong>n compare <strong>the</strong>se rates<br />
for each group to identify <strong>the</strong> unique<br />
contributions to disparity made by each<br />
decision po<strong>in</strong>t.<br />
For example, once referred to court <strong>in</strong>take,<br />
a decision is made to determ<strong>in</strong>e whe<strong>the</strong>r<br />
<strong>the</strong> matter will be h<strong>and</strong>led formally, with<br />
<strong>the</strong> fil<strong>in</strong>g of a petition request<strong>in</strong>g an adjudicatory<br />
or waiver hear<strong>in</strong>g, or <strong>in</strong>formally.<br />
To determ<strong>in</strong>e <strong>the</strong> RRI for <strong>Hispanic</strong> youth<br />
compared with white youth or black<br />
youth, <strong>the</strong> RRI compares <strong>the</strong> proportions<br />
(or rates) of court referrals that are h<strong>and</strong>led<br />
formally for each racial group be<strong>in</strong>g<br />
compared. If <strong>the</strong> rate of formally h<strong>and</strong>led<br />
cases relative to court referrals for <strong>Hispanic</strong><br />
youth is greater than <strong>the</strong> rate for<br />
ano<strong>the</strong>r race, <strong>the</strong>n <strong>the</strong>re is disparity. If<br />
<strong>the</strong> rates are similar, <strong>the</strong>n <strong>the</strong>re is no<br />
disparity. To simplify <strong>the</strong> comparison of<br />
<strong>the</strong>se statistics, <strong>the</strong> RRI is <strong>the</strong> rate for<br />
<strong>Hispanic</strong> youth divided by <strong>the</strong> rate for <strong>the</strong><br />
o<strong>the</strong>r race at each decision po<strong>in</strong>t. If <strong>the</strong><br />
RRI ratio is near or equal to 1.0, <strong>the</strong>re is<br />
no evidence of disparity; if <strong>the</strong> ratio is<br />
greater than 1.0 (if <strong>the</strong> rate for <strong>Hispanic</strong><br />
youth is larger than <strong>the</strong> rate for <strong>the</strong> o<strong>the</strong>r<br />
race), <strong>the</strong>re is evidence of disparity. Each<br />
decision po<strong>in</strong>t has a preced<strong>in</strong>g stage with<br />
which it is compared. Toge<strong>the</strong>r this set of<br />
decision po<strong>in</strong>ts <strong>and</strong> <strong>the</strong>ir relative rate<br />
<strong>in</strong>dexes form <strong>the</strong> Relative Rate Index<br />
Matrix, a table that can reveal <strong>the</strong> nature<br />
of decision disparities—<strong>in</strong>clud<strong>in</strong>g <strong>the</strong>ir<br />
magnitude <strong>and</strong> differences—<strong>in</strong> a juvenile<br />
justice system that is <strong>in</strong>terdependent,<br />
though fragmented.<br />
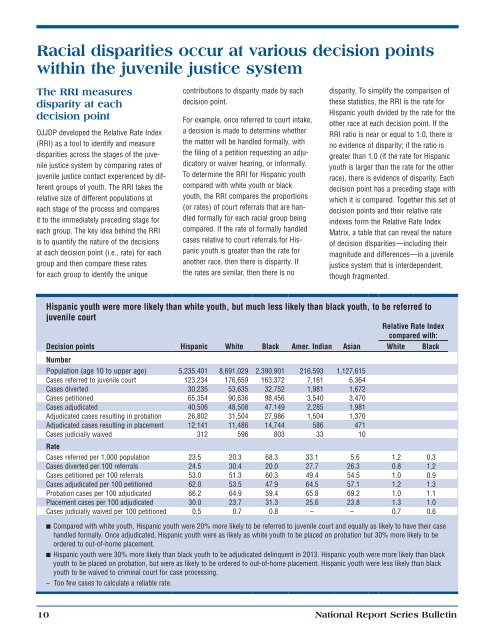
<strong>Hispanic</strong> youth were more likely than white youth, but much less likely than black youth, to be referred to<br />
juvenile court<br />
Relative Rate Index<br />
compared with:<br />
Decision po<strong>in</strong>ts <strong>Hispanic</strong> White Black Amer. Indian Asian White Black<br />
Number<br />
Population (age 10 to upper age) 5,235,401 8,691,029 2,390,901 216,593 1,127,615<br />
Cases referred to juvenile court 123,234 176,659 163,372 7,161 6,364<br />
Cases diverted 30,235 53,635 32,752 1,981 1,672<br />
Cases petitioned 65,354 90,636 98,456 3,540 3,470<br />
Cases adjudicated 40,506 48,508 47,149 2,285 1,981<br />
Adjudicated cases result<strong>in</strong>g <strong>in</strong> probation 26,802 31,504 27,986 1,504 1,370<br />
Adjudicated cases result<strong>in</strong>g <strong>in</strong> placement 12,141 11,486 14,744 586 471<br />
Cases judicially waived 312 596 803 33 10<br />
Rate<br />
Cases referred per 1,000 population 23.5 20.3 68.3 33.1 5.6 1.2 0.3<br />
Cases diverted per 100 referrals 24.5 30.4 20.0 27.7 26.3 0.8 1.2<br />
Cases petitioned per 100 referrals 53.0 51.3 60.3 49.4 54.5 1.0 0.9<br />
Cases adjudicated per 100 petitioned 62.0 53.5 47.9 64.5 57.1 1.2 1.3<br />
Probation cases per 100 adjudicated 66.2 64.9 59.4 65.8 69.2 1.0 1.1<br />
Placement cases per 100 adjudicated 30.0 23.7 31.3 25.6 23.8 1.3 1.0<br />
Cases judicially waived per 100 petitioned 0.5 0.7 0.8 – – 0.7 0.6<br />
n Compared with white youth, <strong>Hispanic</strong> youth were 20% more likely to be referred to juvenile court <strong>and</strong> equally as likely to have <strong>the</strong>ir case<br />
h<strong>and</strong>led formally. Once adjudicated, <strong>Hispanic</strong> youth were as likely as white youth to be placed on probation but 30% more likely to be<br />
ordered to out-of-home placement.<br />
n <strong>Hispanic</strong> youth were 30% more likely than black youth to be adjudicated del<strong>in</strong>quent <strong>in</strong> 2013. <strong>Hispanic</strong> youth were more likely than black<br />
youth to be placed on probation, but were as likely to be ordered to out-of-home placement. <strong>Hispanic</strong> youth were less likely than black<br />
youth to be waived to crim<strong>in</strong>al court for case process<strong>in</strong>g.<br />
– Too few cases to calculate a reliable rate.<br />
10<br />
National Report Series Bullet<strong>in</strong>


