

2017 4th Quarter International Trade Council Global Business Confidence Survey
The Global Business Confidence Survey is designed to take the pulse of companies and sectors and reports on the conditions for businesses like yours. It offers valuable insights into trends of US and global business confidence by surveying people from across a broad spectrum of industries. The survey draws information from a range of sectors about current and historical business growth trends, efficiency, employment, regulation and other conditions affecting industry. Key users of statistical data include government agencies, trade bodies, chambers of commerce and academic researchers. This survey report was produced by the International Trade Council (http://www.tradecouncil.org | http://www.itcapproved.org).
The Global Business Confidence Survey is designed to take the pulse of companies and sectors and reports on the conditions for businesses like yours. It offers valuable insights into trends of US and global business confidence by surveying people from across a broad spectrum of industries. The survey draws information from a range of sectors about current and historical business growth trends, efficiency, employment, regulation and other conditions affecting industry.
Key users of statistical data include government agencies, trade bodies, chambers of commerce and academic researchers. This survey report was produced by the International Trade Council (http://www.tradecouncil.org | http://www.itcapproved.org).

Create successful ePaper yourself
Turn your PDF publications into a flip-book with our unique Google optimized e-Paper software.
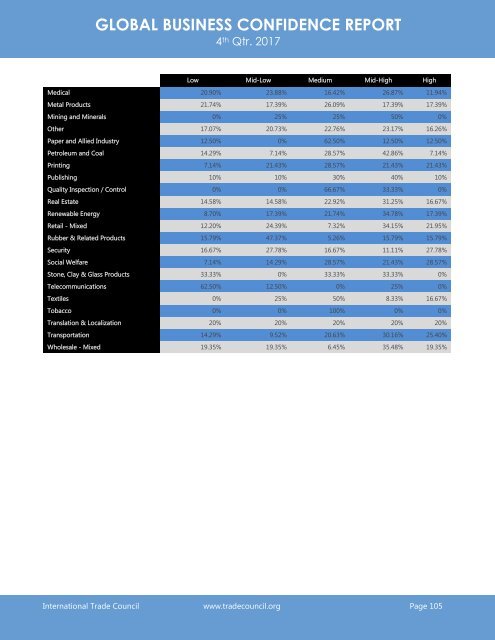
GLOBAL BUSINESS CONFIDENCE REPORT<br />
4 th Qtr. <strong>2017</strong><br />
Low Mid-Low Medium Mid-High High<br />
Medical 20.90% 23.88% 16.42% 26.87% 11.94%<br />
Metal Products 21.74% 17.39% 26.09% 17.39% 17.39%<br />
Mining and Minerals 0% 25% 25% 50% 0%<br />
Other 17.07% 20.73% 22.76% 23.17% 16.26%<br />
Paper and Allied Industry 12.50% 0% 62.50% 12.50% 12.50%<br />
Petroleum and Coal 14.29% 7.14% 28.57% 42.86% 7.14%<br />
Printing 7.14% 21.43% 28.57% 21.43% 21.43%<br />
Publishing 10% 10% 30% 40% 10%<br />
Quality Inspection / Control 0% 0% 66.67% 33.33% 0%<br />
Real Estate 14.58% 14.58% 22.92% 31.25% 16.67%<br />
Renewable Energy 8.70% 17.39% 21.74% 34.78% 17.39%<br />
Retail - Mixed 12.20% 24.39% 7.32% 34.15% 21.95%<br />
Rubber & Related Products 15.79% 47.37% 5.26% 15.79% 15.79%<br />
Security 16.67% 27.78% 16.67% 11.11% 27.78%<br />
Social Welfare 7.14% 14.29% 28.57% 21.43% 28.57%<br />
Stone, Clay & Glass Products 33.33% 0% 33.33% 33.33% 0%<br />
Telecommunications 62.50% 12.50% 0% 25% 0%<br />
Textiles 0% 25% 50% 8.33% 16.67%<br />
Tobacco 0% 0% 100% 0% 0%<br />
Translation & Localization 20% 20% 20% 20% 20%<br />
Transportation 14.29% 9.52% 20.63% 30.16% 25.40%<br />
Wholesale - Mixed 19.35% 19.35% 6.45% 35.48% 19.35%<br />
<strong>International</strong> <strong>Trade</strong> <strong>Council</strong> www.tradecouncil.org Page 105