

2017 4th Quarter International Trade Council Global Business Confidence Survey
The Global Business Confidence Survey is designed to take the pulse of companies and sectors and reports on the conditions for businesses like yours. It offers valuable insights into trends of US and global business confidence by surveying people from across a broad spectrum of industries. The survey draws information from a range of sectors about current and historical business growth trends, efficiency, employment, regulation and other conditions affecting industry. Key users of statistical data include government agencies, trade bodies, chambers of commerce and academic researchers. This survey report was produced by the International Trade Council (http://www.tradecouncil.org | http://www.itcapproved.org).
The Global Business Confidence Survey is designed to take the pulse of companies and sectors and reports on the conditions for businesses like yours. It offers valuable insights into trends of US and global business confidence by surveying people from across a broad spectrum of industries. The survey draws information from a range of sectors about current and historical business growth trends, efficiency, employment, regulation and other conditions affecting industry.
Key users of statistical data include government agencies, trade bodies, chambers of commerce and academic researchers. This survey report was produced by the International Trade Council (http://www.tradecouncil.org | http://www.itcapproved.org).

You also want an ePaper? Increase the reach of your titles
YUMPU automatically turns print PDFs into web optimized ePapers that Google loves.
GLOBAL BUSINESS CONFIDENCE REPORT<br />
4 th Qtr. <strong>2017</strong><br />
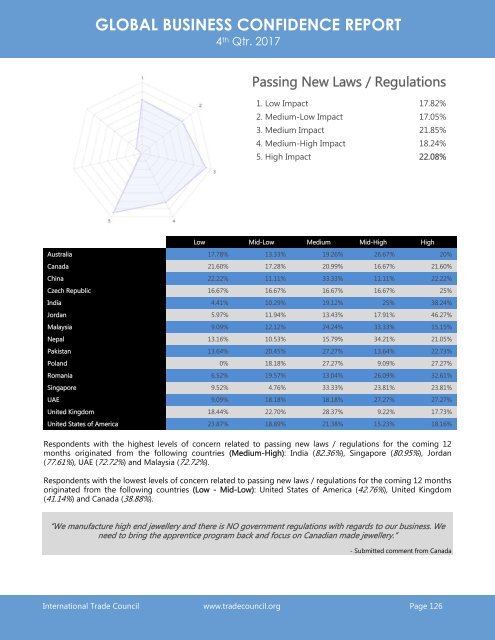
Passing New Laws / Regulations<br />
1. Low Impact 17.82%<br />
2. Medium-Low Impact 17.05%<br />
3. Medium Impact 21.85%<br />
4. Medium-High Impact 18.24%<br />
5. High Impact 22.08%<br />
Low Mid-Low Medium Mid-High High<br />
Australia 17.78% 13.33% 19.26% 26.67% 20%<br />
Canada 21.60% 17.28% 20.99% 16.67% 21.60%<br />
China 22.22% 11.11% 33.33% 11.11% 22.22%<br />
Czech Republic 16.67% 16.67% 16.67% 16.67% 25%<br />
India 4.41% 10.29% 19.12% 25% 38.24%<br />
Jordan 5.97% 11.94% 13.43% 17.91% 46.27%<br />
Malaysia 9.09% 12.12% 24.24% 33.33% 15.15%<br />
Nepal 13.16% 10.53% 15.79% 34.21% 21.05%<br />
Pakistan 13.64% 20.45% 27.27% 13.64% 22.73%<br />
Poland 0% 18.18% 27.27% 9.09% 27.27%<br />
Romania 6.52% 19.57% 13.04% 26.09% 32.61%<br />
Singapore 9.52% 4.76% 33.33% 23.81% 23.81%<br />
UAE 9.09% 18.18% 18.18% 27.27% 27.27%<br />
United Kingdom 18.44% 22.70% 28.37% 9.22% 17.73%<br />
United States of America 23.87% 18.89% 21.38% 15.23% 18.16%<br />
Respondents with the highest levels of concern related to passing new laws / regulations for the coming 12<br />
months originated from the following countries (Medium-High): India (82.36%), Singapore (80.95%), Jordan<br />
(77.61%), UAE (72.72%) and Malaysia (72.72%).<br />
Respondents with the lowest levels of concern related to passing new laws / regulations for the coming 12 months<br />
originated from the following countries (Low - Mid-Low): United States of America (42.76%), United Kingdom<br />
(41.14%) and Canada (38.88%).<br />
“We manufacture high end jewellery and there is NO government regulations with regards to our business. We<br />
need to bring the apprentice program back and focus on Canadian made jewellery.”<br />
- Submitted comment from Canada<br />
<strong>International</strong> <strong>Trade</strong> <strong>Council</strong> www.tradecouncil.org Page 126