

2017 4th Quarter International Trade Council Global Business Confidence Survey
The Global Business Confidence Survey is designed to take the pulse of companies and sectors and reports on the conditions for businesses like yours. It offers valuable insights into trends of US and global business confidence by surveying people from across a broad spectrum of industries. The survey draws information from a range of sectors about current and historical business growth trends, efficiency, employment, regulation and other conditions affecting industry. Key users of statistical data include government agencies, trade bodies, chambers of commerce and academic researchers. This survey report was produced by the International Trade Council (http://www.tradecouncil.org | http://www.itcapproved.org).
The Global Business Confidence Survey is designed to take the pulse of companies and sectors and reports on the conditions for businesses like yours. It offers valuable insights into trends of US and global business confidence by surveying people from across a broad spectrum of industries. The survey draws information from a range of sectors about current and historical business growth trends, efficiency, employment, regulation and other conditions affecting industry.
Key users of statistical data include government agencies, trade bodies, chambers of commerce and academic researchers. This survey report was produced by the International Trade Council (http://www.tradecouncil.org | http://www.itcapproved.org).

Create successful ePaper yourself
Turn your PDF publications into a flip-book with our unique Google optimized e-Paper software.
GLOBAL BUSINESS CONFIDENCE REPORT<br />
4 th Qtr. <strong>2017</strong><br />
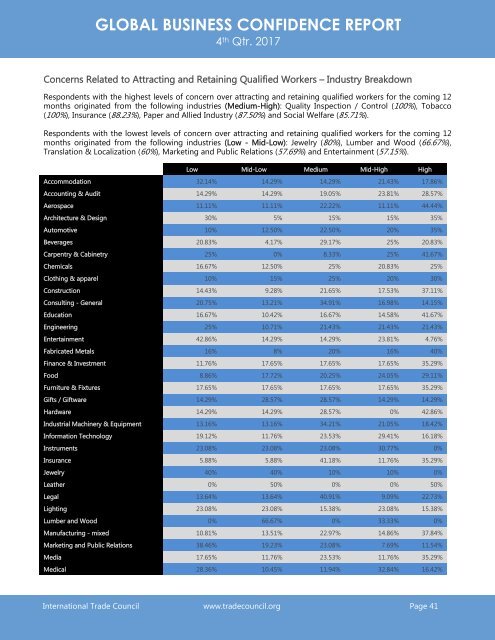
Concerns Related to Attracting and Retaining Qualified Workers – Industry Breakdown<br />
Respondents with the highest levels of concern over attracting and retaining qualified workers for the coming 12<br />
months originated from the following industries (Medium-High): Quality Inspection / Control (100%), Tobacco<br />
(100%), Insurance (88.23%), Paper and Allied Industry (87.50%) and Social Welfare (85.71%).<br />
Respondents with the lowest levels of concern over attracting and retaining qualified workers for the coming 12<br />
months originated from the following industries (Low - Mid-Low): Jewelry (80%), Lumber and Wood (66.67%),<br />
Translation & Localization (60%), Marketing and Public Relations (57.69%) and Entertainment (57.15%).<br />
Low Mid-Low Medium Mid-High High<br />
Accommodation 32.14% 14.29% 14.29% 21.43% 17.86%<br />
Accounting & Audit 14.29% 14.29% 19.05% 23.81% 28.57%<br />
Aerospace 11.11% 11.11% 22.22% 11.11% 44.44%<br />
Architecture & Design 30% 5% 15% 15% 35%<br />
Automotive 10% 12.50% 22.50% 20% 35%<br />
Beverages 20.83% 4.17% 29.17% 25% 20.83%<br />
Carpentry & Cabinetry 25% 0% 8.33% 25% 41.67%<br />
Chemicals 16.67% 12.50% 25% 20.83% 25%<br />
Clothing & apparel 10% 15% 25% 20% 30%<br />
Construction 14.43% 9.28% 21.65% 17.53% 37.11%<br />
Consulting - General 20.75% 13.21% 34.91% 16.98% 14.15%<br />
Education 16.67% 10.42% 16.67% 14.58% 41.67%<br />
Engineering 25% 10.71% 21.43% 21.43% 21.43%<br />
Entertainment 42.86% 14.29% 14.29% 23.81% 4.76%<br />
Fabricated Metals 16% 8% 20% 16% 40%<br />
Finance & Investment 11.76% 17.65% 17.65% 17.65% 35.29%<br />
Food 8.86% 17.72% 20.25% 24.05% 29.11%<br />
Furniture & Fixtures 17.65% 17.65% 17.65% 17.65% 35.29%<br />
Gifts / Giftware 14.29% 28.57% 28.57% 14.29% 14.29%<br />
Hardware 14.29% 14.29% 28.57% 0% 42.86%<br />
Industrial Machinery & Equipment 13.16% 13.16% 34.21% 21.05% 18.42%<br />
Information Technology 19.12% 11.76% 23.53% 29.41% 16.18%<br />
Instruments 23.08% 23.08% 23.08% 30.77% 0%<br />
Insurance 5.88% 5.88% 41.18% 11.76% 35.29%<br />
Jewelry 40% 40% 10% 10% 0%<br />
Leather 0% 50% 0% 0% 50%<br />
Legal 13.64% 13.64% 40.91% 9.09% 22.73%<br />
Lighting 23.08% 23.08% 15.38% 23.08% 15.38%<br />
Lumber and Wood 0% 66.67% 0% 33.33% 0%<br />
Manufacturing - mixed 10.81% 13.51% 22.97% 14.86% 37.84%<br />
Marketing and Public Relations 38.46% 19.23% 23.08% 7.69% 11.54%<br />
Media 17.65% 11.76% 23.53% 11.76% 35.29%<br />
Medical 28.36% 10.45% 11.94% 32.84% 16.42%<br />
<strong>International</strong> <strong>Trade</strong> <strong>Council</strong> www.tradecouncil.org Page 41