

2017 4th Quarter International Trade Council Global Business Confidence Survey
The Global Business Confidence Survey is designed to take the pulse of companies and sectors and reports on the conditions for businesses like yours. It offers valuable insights into trends of US and global business confidence by surveying people from across a broad spectrum of industries. The survey draws information from a range of sectors about current and historical business growth trends, efficiency, employment, regulation and other conditions affecting industry. Key users of statistical data include government agencies, trade bodies, chambers of commerce and academic researchers. This survey report was produced by the International Trade Council (http://www.tradecouncil.org | http://www.itcapproved.org).
The Global Business Confidence Survey is designed to take the pulse of companies and sectors and reports on the conditions for businesses like yours. It offers valuable insights into trends of US and global business confidence by surveying people from across a broad spectrum of industries. The survey draws information from a range of sectors about current and historical business growth trends, efficiency, employment, regulation and other conditions affecting industry.
Key users of statistical data include government agencies, trade bodies, chambers of commerce and academic researchers. This survey report was produced by the International Trade Council (http://www.tradecouncil.org | http://www.itcapproved.org).

You also want an ePaper? Increase the reach of your titles
YUMPU automatically turns print PDFs into web optimized ePapers that Google loves.
GLOBAL BUSINESS CONFIDENCE REPORT<br />
4 th Qtr. <strong>2017</strong><br />
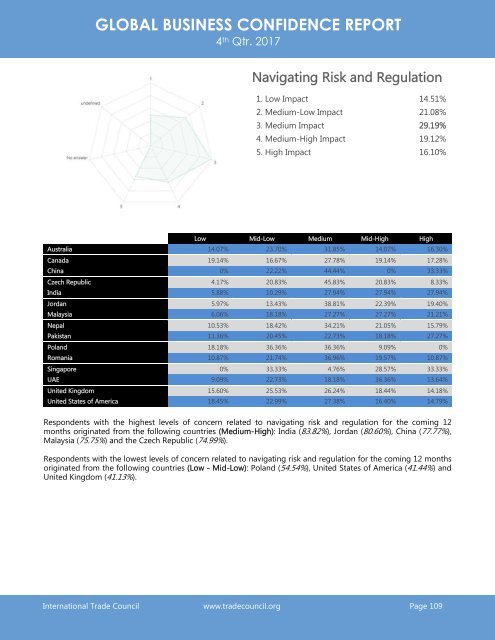
Navigating Risk and Regulation<br />
1. Low Impact 14.51%<br />
2. Medium-Low Impact 21.08%<br />
3. Medium Impact 29.19%<br />
4. Medium-High Impact 19.12%<br />
5. High Impact 16.10%<br />
Low Mid-Low Medium Mid-High High<br />
Australia 14.07% 23.70% 31.85% 14.07% 16.30%<br />
Canada 19.14% 16.67% 27.78% 19.14% 17.28%<br />
China 0% 22.22% 44.44% 0% 33.33%<br />
Czech Republic 4.17% 20.83% 45.83% 20.83% 8.33%<br />
India 5.88% 10.29% 27.94% 27.94% 27.94%<br />
Jordan 5.97% 13.43% 38.81% 22.39% 19.40%<br />
Malaysia 6.06% 18.18% 27.27% 27.27% 21.21%<br />
Nepal 10.53% 18.42% 34.21% 21.05% 15.79%<br />
Pakistan 11.36% 20.45% 22.73% 18.18% 27.27%<br />
Poland 18.18% 36.36% 36.36% 9.09% 0%<br />
Romania 10.87% 21.74% 36.96% 19.57% 10.87%<br />
Singapore 0% 33.33% 4.76% 28.57% 33.33%<br />
UAE 9.09% 22.73% 18.18% 36.36% 13.64%<br />
United Kingdom 15.60% 25.53% 26.24% 18.44% 14.18%<br />
United States of America 18.45% 22.99% 27.38% 16.40% 14.79%<br />
Respondents with the highest levels of concern related to navigating risk and regulation for the coming 12<br />
months originated from the following countries (Medium-High): India (83.82%), Jordan (80.60%), China (77.77%),<br />
Malaysia (75.75%) and the Czech Republic (74.99%).<br />
Respondents with the lowest levels of concern related to navigating risk and regulation for the coming 12 months<br />
originated from the following countries (Low - Mid-Low): Poland (54.54%), United States of America (41.44%) and<br />
United Kingdom (41.13%).<br />
<strong>International</strong> <strong>Trade</strong> <strong>Council</strong> www.tradecouncil.org Page 109