

2017 4th Quarter International Trade Council Global Business Confidence Survey
The Global Business Confidence Survey is designed to take the pulse of companies and sectors and reports on the conditions for businesses like yours. It offers valuable insights into trends of US and global business confidence by surveying people from across a broad spectrum of industries. The survey draws information from a range of sectors about current and historical business growth trends, efficiency, employment, regulation and other conditions affecting industry. Key users of statistical data include government agencies, trade bodies, chambers of commerce and academic researchers. This survey report was produced by the International Trade Council (http://www.tradecouncil.org | http://www.itcapproved.org).
The Global Business Confidence Survey is designed to take the pulse of companies and sectors and reports on the conditions for businesses like yours. It offers valuable insights into trends of US and global business confidence by surveying people from across a broad spectrum of industries. The survey draws information from a range of sectors about current and historical business growth trends, efficiency, employment, regulation and other conditions affecting industry.
Key users of statistical data include government agencies, trade bodies, chambers of commerce and academic researchers. This survey report was produced by the International Trade Council (http://www.tradecouncil.org | http://www.itcapproved.org).

You also want an ePaper? Increase the reach of your titles
YUMPU automatically turns print PDFs into web optimized ePapers that Google loves.
GLOBAL BUSINESS CONFIDENCE REPORT<br />
4 th Qtr. <strong>2017</strong><br />
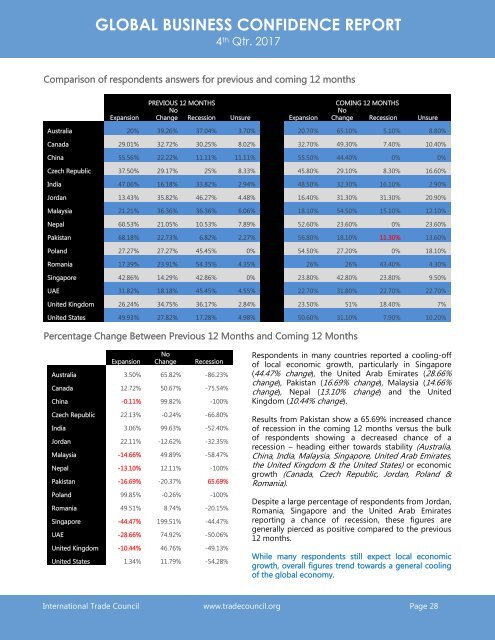
Comparison of respondents answers for previous and coming 12 months<br />
Expansion<br />
PREVIOUS 12 MONTHS<br />
No<br />
Change Recession Unsure Expansion<br />
COMING 12 MONTHS<br />
No<br />
Change Recession Unsure<br />
Australia 20% 39.26% 37.04% 3.70% 20.70% 65.10% 5.10% 8.80%<br />
Canada 29.01% 32.72% 30.25% 8.02% 32.70% 49.30% 7.40% 10.40%<br />
China 55.56% 22.22% 11.11% 11.11% 55.50% 44.40% 0% 0%<br />
Czech Republic 37.50% 29.17% 25% 8.33% 45.80% 29.10% 8.30% 16.60%<br />
India 47.06% 16.18% 33.82% 2.94% 48.50% 32.30% 16.10% 2.90%<br />
Jordan 13.43% 35.82% 46.27% 4.48% 16.40% 31.30% 31.30% 20.90%<br />
Malaysia 21.21% 36.36% 36.36% 6.06% 18.10% 54.50% 15.10% 12.10%<br />
Nepal 60.53% 21.05% 10.53% 7.89% 52.60% 23.60% 0% 23.60%<br />
Pakistan 68.18% 22.73% 6.82% 2.27% 56.80% 18.10% 11.30% 13.60%<br />
Poland 27.27% 27.27% 45.45% 0% 54.50% 27.20% 0% 18.10%<br />
Romania 17.39% 23.91% 54.35% 4.35% 26% 26% 43.40% 4.30%<br />
Singapore 42.86% 14.29% 42.86% 0% 23.80% 42.80% 23.80% 9.50%<br />
UAE 31.82% 18.18% 45.45% 4.55% 22.70% 31.80% 22.70% 22.70%<br />
United Kingdom 26.24% 34.75% 36.17% 2.84% 23.50% 51% 18.40% 7%<br />
United States 49.93% 27.82% 17.28% 4.98% 50.60% 31.10% 7.90% 10.20%<br />
Percentage Change Between Previous 12 Months and Coming 12 Months<br />
Expansion<br />
No<br />
Change<br />
Recession<br />
Australia 3.50% 65.82% -86.23%<br />
Canada 12.72% 50.67% -75.54%<br />
China -0.11% 99.82% -100%<br />
Czech Republic 22.13% -0.24% -66.80%<br />
India 3.06% 99.63% -52.40%<br />
Jordan 22.11% -12.62% -32.35%<br />
Malaysia -14.66% 49.89% -58.47%<br />
Nepal -13.10% 12.11% -100%<br />
Pakistan -16.69% -20.37% 65.69%<br />
Poland 99.85% -0.26% -100%<br />
Romania 49.51% 8.74% -20.15%<br />
Singapore -44.47% 199.51% -44.47%<br />
UAE -28.66% 74.92% -50.06%<br />
United Kingdom -10.44% 46.76% -49.13%<br />
United States 1.34% 11.79% -54.28%<br />
Respondents in many countries reported a cooling-off<br />
of local economic growth, particularly in Singapore<br />
(44.47% change), the United Arab Emirates (28.66%<br />
change), Pakistan (16.69% change), Malaysia (14.66%<br />
change), Nepal (13.10% change) and the United<br />
Kingdom (10.44% change).<br />
Results from Pakistan show a 65.69% increased chance<br />
of recession in the coming 12 months versus the bulk<br />
of respondents showing a decreased chance of a<br />
recession – heading either towards stability (Australia,<br />
China, India, Malaysia, Singapore, United Arab Emirates,<br />
the United Kingdom & the United States) or economic<br />
growth (Canada, Czech Republic, Jordan, Poland &<br />
Romania).<br />
Despite a large percentage of respondents from Jordan,<br />
Romania, Singapore and the United Arab Emirates<br />
reporting a chance of recession, these figures are<br />
generally pierced as positive compared to the previous<br />
12 months.<br />
While many respondents still expect local economic<br />
growth, overall figures trend towards a general cooling<br />
of the global economy.<br />
<strong>International</strong> <strong>Trade</strong> <strong>Council</strong> www.tradecouncil.org Page 28