

2017 4th Quarter International Trade Council Global Business Confidence Survey
The Global Business Confidence Survey is designed to take the pulse of companies and sectors and reports on the conditions for businesses like yours. It offers valuable insights into trends of US and global business confidence by surveying people from across a broad spectrum of industries. The survey draws information from a range of sectors about current and historical business growth trends, efficiency, employment, regulation and other conditions affecting industry. Key users of statistical data include government agencies, trade bodies, chambers of commerce and academic researchers. This survey report was produced by the International Trade Council (http://www.tradecouncil.org | http://www.itcapproved.org).
The Global Business Confidence Survey is designed to take the pulse of companies and sectors and reports on the conditions for businesses like yours. It offers valuable insights into trends of US and global business confidence by surveying people from across a broad spectrum of industries. The survey draws information from a range of sectors about current and historical business growth trends, efficiency, employment, regulation and other conditions affecting industry.
Key users of statistical data include government agencies, trade bodies, chambers of commerce and academic researchers. This survey report was produced by the International Trade Council (http://www.tradecouncil.org | http://www.itcapproved.org).

You also want an ePaper? Increase the reach of your titles
YUMPU automatically turns print PDFs into web optimized ePapers that Google loves.
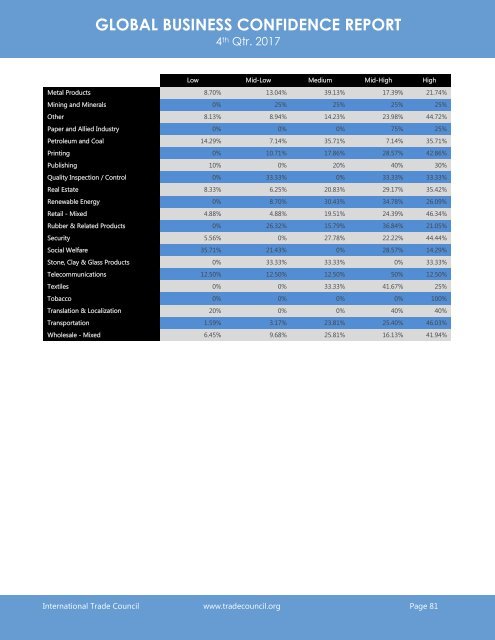
GLOBAL BUSINESS CONFIDENCE REPORT<br />
4 th Qtr. <strong>2017</strong><br />
Low Mid-Low Medium Mid-High High<br />
Metal Products 8.70% 13.04% 39.13% 17.39% 21.74%<br />
Mining and Minerals 0% 25% 25% 25% 25%<br />
Other 8.13% 8.94% 14.23% 23.98% 44.72%<br />
Paper and Allied Industry 0% 0% 0% 75% 25%<br />
Petroleum and Coal 14.29% 7.14% 35.71% 7.14% 35.71%<br />
Printing 0% 10.71% 17.86% 28.57% 42.86%<br />
Publishing 10% 0% 20% 40% 30%<br />
Quality Inspection / Control 0% 33.33% 0% 33.33% 33.33%<br />
Real Estate 8.33% 6.25% 20.83% 29.17% 35.42%<br />
Renewable Energy 0% 8.70% 30.43% 34.78% 26.09%<br />
Retail - Mixed 4.88% 4.88% 19.51% 24.39% 46.34%<br />
Rubber & Related Products 0% 26.32% 15.79% 36.84% 21.05%<br />
Security 5.56% 0% 27.78% 22.22% 44.44%<br />
Social Welfare 35.71% 21.43% 0% 28.57% 14.29%<br />
Stone, Clay & Glass Products 0% 33.33% 33.33% 0% 33.33%<br />
Telecommunications 12.50% 12.50% 12.50% 50% 12.50%<br />
Textiles 0% 0% 33.33% 41.67% 25%<br />
Tobacco 0% 0% 0% 0% 100%<br />
Translation & Localization 20% 0% 0% 40% 40%<br />
Transportation 1.59% 3.17% 23.81% 25.40% 46.03%<br />
Wholesale - Mixed 6.45% 9.68% 25.81% 16.13% 41.94%<br />
<strong>International</strong> <strong>Trade</strong> <strong>Council</strong> www.tradecouncil.org Page 81