

2017 4th Quarter International Trade Council Global Business Confidence Survey
The Global Business Confidence Survey is designed to take the pulse of companies and sectors and reports on the conditions for businesses like yours. It offers valuable insights into trends of US and global business confidence by surveying people from across a broad spectrum of industries. The survey draws information from a range of sectors about current and historical business growth trends, efficiency, employment, regulation and other conditions affecting industry. Key users of statistical data include government agencies, trade bodies, chambers of commerce and academic researchers. This survey report was produced by the International Trade Council (http://www.tradecouncil.org | http://www.itcapproved.org).
The Global Business Confidence Survey is designed to take the pulse of companies and sectors and reports on the conditions for businesses like yours. It offers valuable insights into trends of US and global business confidence by surveying people from across a broad spectrum of industries. The survey draws information from a range of sectors about current and historical business growth trends, efficiency, employment, regulation and other conditions affecting industry.
Key users of statistical data include government agencies, trade bodies, chambers of commerce and academic researchers. This survey report was produced by the International Trade Council (http://www.tradecouncil.org | http://www.itcapproved.org).

Create successful ePaper yourself
Turn your PDF publications into a flip-book with our unique Google optimized e-Paper software.
GLOBAL BUSINESS CONFIDENCE REPORT<br />
4 th Qtr. <strong>2017</strong><br />
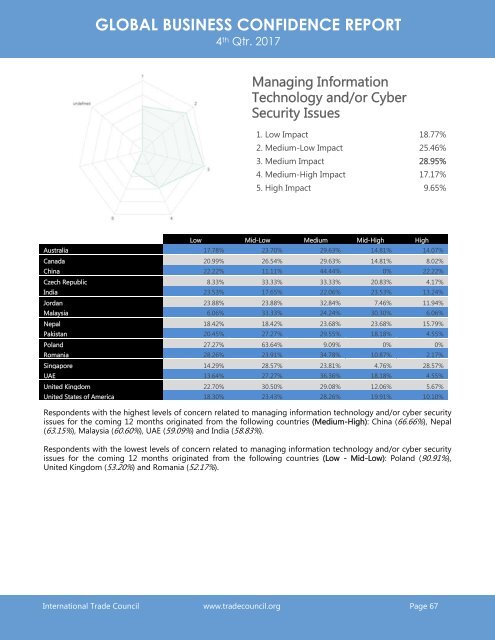
Managing Information<br />
Technology and/or Cyber<br />
Security Issues<br />
1. Low Impact 18.77%<br />
2. Medium-Low Impact 25.46%<br />
3. Medium Impact 28.95%<br />
4. Medium-High Impact 17.17%<br />
5. High Impact 9.65%<br />
Low Mid-Low Medium Mid-High High<br />
Australia 17.78% 23.70% 29.63% 14.81% 14.07%<br />
Canada 20.99% 26.54% 29.63% 14.81% 8.02%<br />
China 22.22% 11.11% 44.44% 0% 22.22%<br />
Czech Republic 8.33% 33.33% 33.33% 20.83% 4.17%<br />
India 23.53% 17.65% 22.06% 23.53% 13.24%<br />
Jordan 23.88% 23.88% 32.84% 7.46% 11.94%<br />
Malaysia 6.06% 33.33% 24.24% 30.30% 6.06%<br />
Nepal 18.42% 18.42% 23.68% 23.68% 15.79%<br />
Pakistan 20.45% 27.27% 29.55% 18.18% 4.55%<br />
Poland 27.27% 63.64% 9.09% 0% 0%<br />
Romania 28.26% 23.91% 34.78% 10.87% 2.17%<br />
Singapore 14.29% 28.57% 23.81% 4.76% 28.57%<br />
UAE 13.64% 27.27% 36.36% 18.18% 4.55%<br />
United Kingdom 22.70% 30.50% 29.08% 12.06% 5.67%<br />
United States of America 18.30% 23.43% 28.26% 19.91% 10.10%<br />
Respondents with the highest levels of concern related to managing information technology and/or cyber security<br />
issues for the coming 12 months originated from the following countries (Medium-High): China (66.66%), Nepal<br />
(63.15%), Malaysia (60.60%), UAE (59.09%) and India (58.83%).<br />
Respondents with the lowest levels of concern related to managing information technology and/or cyber security<br />
issues for the coming 12 months originated from the following countries (Low - Mid-Low): Poland (90.91%),<br />
United Kingdom (53.20%) and Romania (52.17%).<br />
<strong>International</strong> <strong>Trade</strong> <strong>Council</strong> www.tradecouncil.org Page 67