

2017 4th Quarter International Trade Council Global Business Confidence Survey
The Global Business Confidence Survey is designed to take the pulse of companies and sectors and reports on the conditions for businesses like yours. It offers valuable insights into trends of US and global business confidence by surveying people from across a broad spectrum of industries. The survey draws information from a range of sectors about current and historical business growth trends, efficiency, employment, regulation and other conditions affecting industry. Key users of statistical data include government agencies, trade bodies, chambers of commerce and academic researchers. This survey report was produced by the International Trade Council (http://www.tradecouncil.org | http://www.itcapproved.org).
The Global Business Confidence Survey is designed to take the pulse of companies and sectors and reports on the conditions for businesses like yours. It offers valuable insights into trends of US and global business confidence by surveying people from across a broad spectrum of industries. The survey draws information from a range of sectors about current and historical business growth trends, efficiency, employment, regulation and other conditions affecting industry.
Key users of statistical data include government agencies, trade bodies, chambers of commerce and academic researchers. This survey report was produced by the International Trade Council (http://www.tradecouncil.org | http://www.itcapproved.org).

You also want an ePaper? Increase the reach of your titles
YUMPU automatically turns print PDFs into web optimized ePapers that Google loves.
GLOBAL BUSINESS CONFIDENCE REPORT<br />
4 th Qtr. <strong>2017</strong><br />
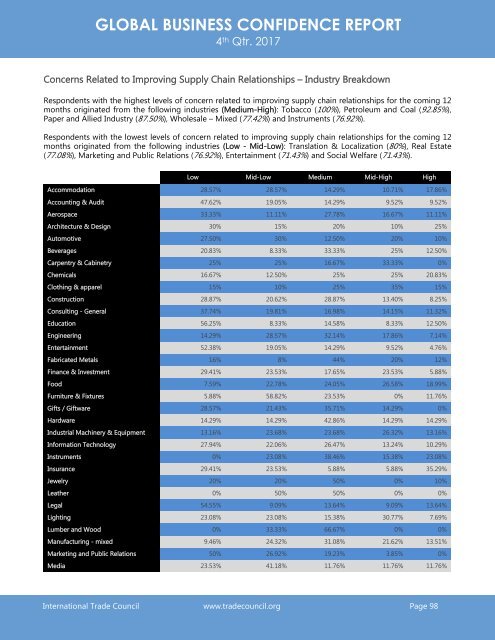
Concerns Related to Improving Supply Chain Relationships – Industry Breakdown<br />
Respondents with the highest levels of concern related to improving supply chain relationships for the coming 12<br />
months originated from the following industries (Medium-High): Tobacco (100%), Petroleum and Coal (92.85%),<br />
Paper and Allied Industry (87.50%), Wholesale – Mixed (77.42%) and Instruments (76.92%).<br />
Respondents with the lowest levels of concern related to improving supply chain relationships for the coming 12<br />
months originated from the following industries (Low - Mid-Low): Translation & Localization (80%), Real Estate<br />
(77.08%), Marketing and Public Relations (76.92%), Entertainment (71.43%) and Social Welfare (71.43%).<br />
Low Mid-Low Medium Mid-High High<br />
Accommodation 28.57% 28.57% 14.29% 10.71% 17.86%<br />
Accounting & Audit 47.62% 19.05% 14.29% 9.52% 9.52%<br />
Aerospace 33.33% 11.11% 27.78% 16.67% 11.11%<br />
Architecture & Design 30% 15% 20% 10% 25%<br />
Automotive 27.50% 30% 12.50% 20% 10%<br />
Beverages 20.83% 8.33% 33.33% 25% 12.50%<br />
Carpentry & Cabinetry 25% 25% 16.67% 33.33% 0%<br />
Chemicals 16.67% 12.50% 25% 25% 20.83%<br />
Clothing & apparel 15% 10% 25% 35% 15%<br />
Construction 28.87% 20.62% 28.87% 13.40% 8.25%<br />
Consulting - General 37.74% 19.81% 16.98% 14.15% 11.32%<br />
Education 56.25% 8.33% 14.58% 8.33% 12.50%<br />
Engineering 14.29% 28.57% 32.14% 17.86% 7.14%<br />
Entertainment 52.38% 19.05% 14.29% 9.52% 4.76%<br />
Fabricated Metals 16% 8% 44% 20% 12%<br />
Finance & Investment 29.41% 23.53% 17.65% 23.53% 5.88%<br />
Food 7.59% 22.78% 24.05% 26.58% 18.99%<br />
Furniture & Fixtures 5.88% 58.82% 23.53% 0% 11.76%<br />
Gifts / Giftware 28.57% 21.43% 35.71% 14.29% 0%<br />
Hardware 14.29% 14.29% 42.86% 14.29% 14.29%<br />
Industrial Machinery & Equipment 13.16% 23.68% 23.68% 26.32% 13.16%<br />
Information Technology 27.94% 22.06% 26.47% 13.24% 10.29%<br />
Instruments 0% 23.08% 38.46% 15.38% 23.08%<br />
Insurance 29.41% 23.53% 5.88% 5.88% 35.29%<br />
Jewelry 20% 20% 50% 0% 10%<br />
Leather 0% 50% 50% 0% 0%<br />
Legal 54.55% 9.09% 13.64% 9.09% 13.64%<br />
Lighting 23.08% 23.08% 15.38% 30.77% 7.69%<br />
Lumber and Wood 0% 33.33% 66.67% 0% 0%<br />
Manufacturing - mixed 9.46% 24.32% 31.08% 21.62% 13.51%<br />
Marketing and Public Relations 50% 26.92% 19.23% 3.85% 0%<br />
Media 23.53% 41.18% 11.76% 11.76% 11.76%<br />
<strong>International</strong> <strong>Trade</strong> <strong>Council</strong> www.tradecouncil.org Page 98