Competing in the Global Economy – The Innovation Challenge
Competing in the Global Economy – The Innovation Challenge
Competing in the Global Economy – The Innovation Challenge

You also want an ePaper? Increase the reach of your titles
YUMPU automatically turns print PDFs into web optimized ePapers that Google loves.
UK owned establishments. And similar productivity distributions have been found <strong>in</strong><br />
o<strong>the</strong>r OECD countries. This suggests that <strong>the</strong> UK does not have an especially ‘long tail<br />
of under-perform<strong>in</strong>g firms’ that lowers <strong>the</strong> UK average relative to o<strong>the</strong>r countries 5 .<br />
Some of <strong>the</strong> difference between <strong>the</strong> UK and European countries is probably due to<br />
differences <strong>in</strong> labour market structures and costs. Comparatively <strong>the</strong> UK labour market<br />
is lightly regulated. Excessively strict or complicated labour market regulations can<br />
discourage employment and raise unemployment. Attempts to artificially reduce <strong>the</strong><br />
supply of labour <strong>–</strong> for example <strong>the</strong> use of early retirement programmes or forced<br />
reductions <strong>in</strong> hours worked <strong>–</strong> might lead to <strong>in</strong>creases <strong>in</strong> average productivity <strong>in</strong> <strong>the</strong><br />
short-term. But <strong>the</strong>se differences are not an adequate explanation for <strong>the</strong> productivity<br />
gap that exists with <strong>the</strong> US, which is considered to have one of <strong>the</strong> most flexible labour<br />
markets <strong>in</strong> <strong>the</strong> OECD area and <strong>in</strong>tegrates a slightly larger share of its workforce <strong>in</strong>to<br />
employment than <strong>the</strong> UK.<br />
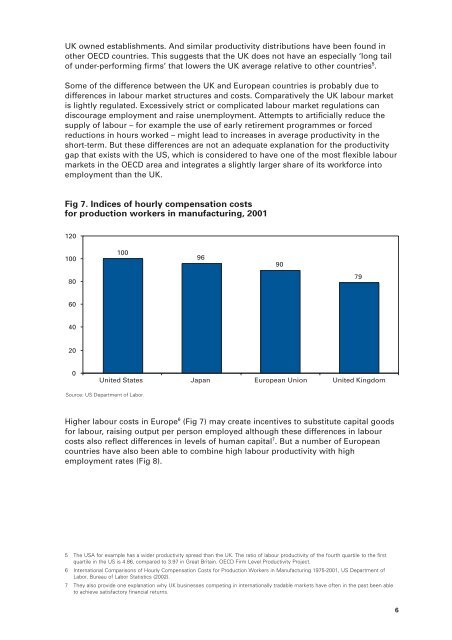
Fig 7. Indices of hourly compensation costs<br />
for production workers <strong>in</strong> manufactur<strong>in</strong>g, 2001<br />
120<br />
100<br />
80<br />
60<br />
40<br />
20<br />
0<br />
100<br />
96<br />
United States Japan European Union United K<strong>in</strong>gdom<br />
Source: US Department of Labor.<br />
Higher labour costs <strong>in</strong> Europe 6 (Fig 7) may create <strong>in</strong>centives to substitute capital goods<br />
for labour, rais<strong>in</strong>g output per person employed although <strong>the</strong>se differences <strong>in</strong> labour<br />
costs also reflect differences <strong>in</strong> levels of human capital 7 . But a number of European<br />
countries have also been able to comb<strong>in</strong>e high labour productivity with high<br />
employment rates (Fig 8).<br />
5 <strong>The</strong> USA for example has a wider productivity spread than <strong>the</strong> UK. <strong>The</strong> ratio of labour productivity of <strong>the</strong> fourth quartile to <strong>the</strong> first<br />
quartile <strong>in</strong> <strong>the</strong> US is 4.86, compared to 3.97 <strong>in</strong> Great Brita<strong>in</strong>. OECD Firm Level Productivity Project.<br />
6 International Comparisons of Hourly Compensation Costs for Production Workers <strong>in</strong> Manufactur<strong>in</strong>g 1975-2001, US Department of<br />
Labor, Bureau of Labor Statistics (2002).<br />
7 <strong>The</strong>y also provide one explanation why UK bus<strong>in</strong>esses compet<strong>in</strong>g <strong>in</strong> <strong>in</strong>ternationally tradable markets have often <strong>in</strong> <strong>the</strong> past been able<br />
to achieve satisfactory f<strong>in</strong>ancial returns.<br />
90<br />
79<br />
6