Competing in the Global Economy – The Innovation Challenge
Competing in the Global Economy – The Innovation Challenge
Competing in the Global Economy – The Innovation Challenge

Create successful ePaper yourself
Turn your PDF publications into a flip-book with our unique Google optimized e-Paper software.
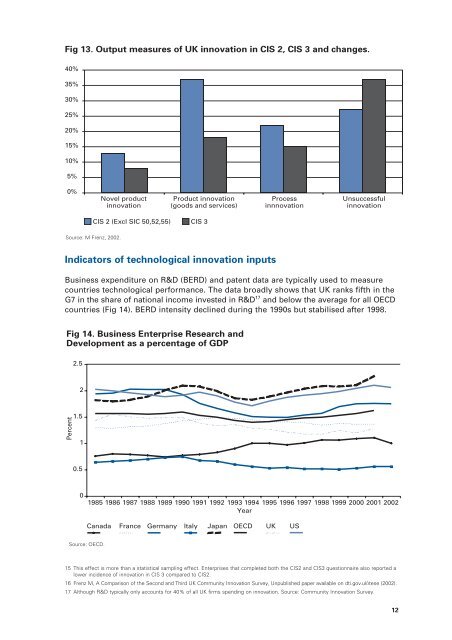
Fig 13. Output measures of UK <strong>in</strong>novation <strong>in</strong> CIS 2, CIS 3 and changes.<br />
40%<br />
35%<br />
30%<br />
25%<br />
20%<br />
15%<br />
10%<br />
5%<br />
0%<br />
Indicators of technological <strong>in</strong>novation <strong>in</strong>puts<br />
Bus<strong>in</strong>ess expenditure on R&D (BERD) and patent data are typically used to measure<br />
countries technological performance. <strong>The</strong> data broadly shows that UK ranks fifth <strong>in</strong> <strong>the</strong><br />
G7 <strong>in</strong> <strong>the</strong> share of national <strong>in</strong>come <strong>in</strong>vested <strong>in</strong> R&D 17 and below <strong>the</strong> average for all OECD<br />
countries (Fig 14). BERD <strong>in</strong>tensity decl<strong>in</strong>ed dur<strong>in</strong>g <strong>the</strong> 1990s but stabilised after 1998.<br />
Fig 14. Bus<strong>in</strong>ess Enterprise Research and<br />
Development as a percentage of GDP<br />
Percent<br />
2.5<br />
2<br />
1.5<br />
1<br />
0.5<br />
0<br />
Source: OECD.<br />
Novel product<br />
<strong>in</strong>novation<br />
Product <strong>in</strong>novation<br />
(goods and services)<br />
CIS 2 (Excl SIC 50,52,55) CIS 3<br />
Source: M Frenz, 2002.<br />
Process<br />
<strong>in</strong>nnovation<br />
1985 1986 1987 1988 1989 1990 1991 1992 1993 1994 1995 1996 1997 1998 1999 2000 2001 2002<br />
Year<br />
Canada France Germany Italy Japan OECD UK US<br />
Unsuccessful<br />
<strong>in</strong>novation<br />
15 This effect is more than a statistical sampl<strong>in</strong>g effect. Enterprises that completed both <strong>the</strong> CIS2 and CIS3 questionnaire also reported a<br />
lower <strong>in</strong>cidence of <strong>in</strong>novation <strong>in</strong> CIS 3 compared to CIS2.<br />
16 Frenz M, A Comparison of <strong>the</strong> Second and Third UK Community <strong>Innovation</strong> Survey, Unpublished paper available on dti.gov.uk\tese (2002).<br />
17 Although R&D typically only accounts for 40% of all UK firms spend<strong>in</strong>g on <strong>in</strong>novation. Source: Community <strong>Innovation</strong> Survey.<br />
12