Competing in the Global Economy – The Innovation Challenge
Competing in the Global Economy – The Innovation Challenge
Competing in the Global Economy – The Innovation Challenge

Create successful ePaper yourself
Turn your PDF publications into a flip-book with our unique Google optimized e-Paper software.
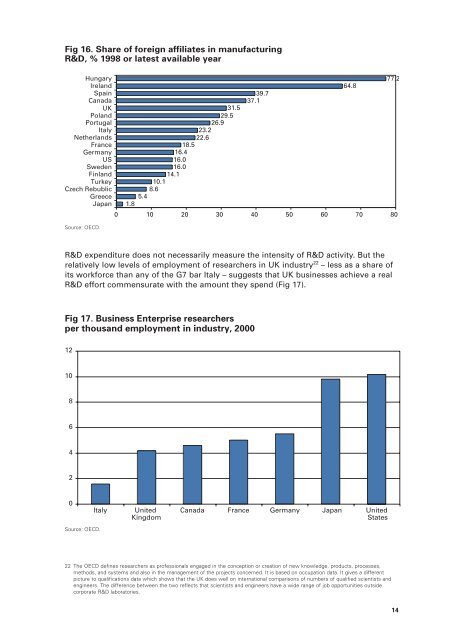
Fig 16. Share of foreign affiliates <strong>in</strong> manufactur<strong>in</strong>g<br />
R&D, % 1998 or latest available year<br />
Hungary<br />
Ireland<br />
Spa<strong>in</strong><br />
Canada<br />
UK<br />
Poland<br />
Portugal<br />
Italy<br />
Ne<strong>the</strong>rlands<br />
France<br />
Germany<br />
US<br />
Sweden<br />
F<strong>in</strong>land<br />
Turkey<br />
Czech Rebublic<br />
Greece<br />
Japan<br />
Source: OECD.<br />
R&D expenditure does not necessarily measure <strong>the</strong> <strong>in</strong>tensity of R&D activity. But <strong>the</strong><br />
relatively low levels of employment of researchers <strong>in</strong> UK <strong>in</strong>dustry 22 <strong>–</strong> less as a share of<br />
its workforce than any of <strong>the</strong> G7 bar Italy <strong>–</strong> suggests that UK bus<strong>in</strong>esses achieve a real<br />
R&D effort commensurate with <strong>the</strong> amount <strong>the</strong>y spend (Fig 17).<br />
Fig 17. Bus<strong>in</strong>ess Enterprise researchers<br />
per thousand employment <strong>in</strong> <strong>in</strong>dustry, 2000<br />
12<br />
10<br />
8<br />
6<br />
4<br />
2<br />
0<br />
Source: OECD.<br />
1.8<br />
5.4<br />
Italy United<br />
K<strong>in</strong>gdom<br />
31.5<br />
29.5<br />
26.9<br />
23.2<br />
22.6<br />
18.5<br />
16.4<br />
16.0<br />
16.0<br />
14.1<br />
10.1<br />
8.6<br />
39.7<br />
37.1<br />
0 10 20 30 40 50 60 70 80<br />
Canada France Germany Japan United<br />
States<br />
22 <strong>The</strong> OECD def<strong>in</strong>es researchers as professionals engaged <strong>in</strong> <strong>the</strong> conception or creation of new knowledge, products, processes,<br />
methods, and systems and also <strong>in</strong> <strong>the</strong> management of <strong>the</strong> projects concerned. It is based on occupation data. It gives a different<br />
picture to qualifications data which shows that <strong>the</strong> UK does well on <strong>in</strong>ternational comparisons of numbers of qualified scientists and<br />
eng<strong>in</strong>eers. <strong>The</strong> difference between <strong>the</strong> two reflects that scientists and eng<strong>in</strong>eers have a wide range of job opportunities outside<br />
corporate R&D laboratories.<br />
64.8<br />
77.2<br />
14