


Create successful ePaper yourself
Turn your PDF publications into a flip-book with our unique Google optimized e-Paper software.
highest for baseball, which reflects its extensive minor league<br />
system. Relatively few make it from the minor to major leagues.<br />
Corresponding probabilities for other sports are considerably<br />
lower.<br />
Sport background and career trajectories of talented athletes<br />
provide additional insights into the relative merits of<br />
early specialization. For example, ‘‘quick’’ (e4 yr) and ‘‘slow’’<br />
(Q10 yr) tracks from novice to elite status were identified<br />
10.000 horas o 10 años <br />
among senior national Australian athletes. Compared with<br />
athletes on the ‘‘slow’’ trajectory, those on the ‘‘quick’’ path<br />
began their main sport at a later age (17.1 T 4.5 vs 7.9 T<br />
experience in diving (42).<br />
POTENTIAL RISKS OF SPECIALIZATION<br />
Early specialization is not without risk. Several subsequently<br />
are noted.<br />
Social Isolation<br />
Focus on a single sport and the associated time commitment<br />
may foster isolation from age and sex peers, especially<br />
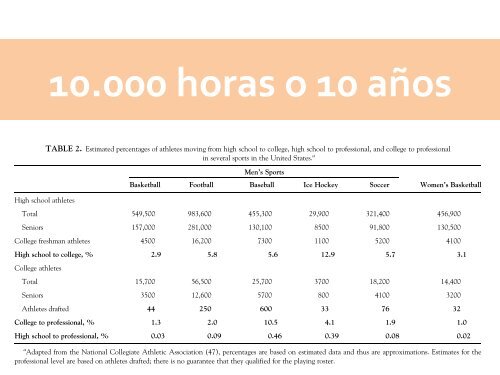
TABLE 2. Estimated percentages of athletes moving from high school to college, high school to professional, and college to professional<br />
in several sports in the United States. a<br />
Men’s Sports<br />
Basketball Football Baseball Ice Hockey Soccer<br />
Women’s Basketball<br />
High school athletes<br />
Total 549,500 983,600 455,300 29,900 321,400 456,900<br />
Seniors 157,000 281,000 130,100 8500 91,800 130,500<br />
College freshman athletes 4500 16,200 7300 1100 5200 4100<br />
High school to college, % 2.9 5.8 5.6 12.9 5.7 3.1<br />
College athletes<br />
Total 15,700 56,500 25,700 3700 18,200 14,400<br />
Seniors 3500 12,600 5700 800 4100 3200<br />
Athletes drafted 44 250 600 33 76 32<br />
College to professional, % 1.3 2.0 10.5 4.1 1.9 1.0<br />
High school to professional, % 0.03 0.09 0.46 0.39 0.08 0.02<br />
a Adapted from the National Collegiate Athletic Association (47), percentages are based on estimated data and thus are approximations. Estimates for the<br />
professional level are based on athletes drafted; there is no guarantee that they qualified for the playing roster.