Annual Report 2009 Royal BAM Group nv
Annual Report 2009 Royal BAM Group nv
Annual Report 2009 Royal BAM Group nv

Create successful ePaper yourself
Turn your PDF publications into a flip-book with our unique Google optimized e-Paper software.
100<br />
<strong>2009</strong><br />
29<br />
8<br />
9<br />
9, 26<br />
8, 26<br />
28<br />
28<br />
11<br />
21,22<br />
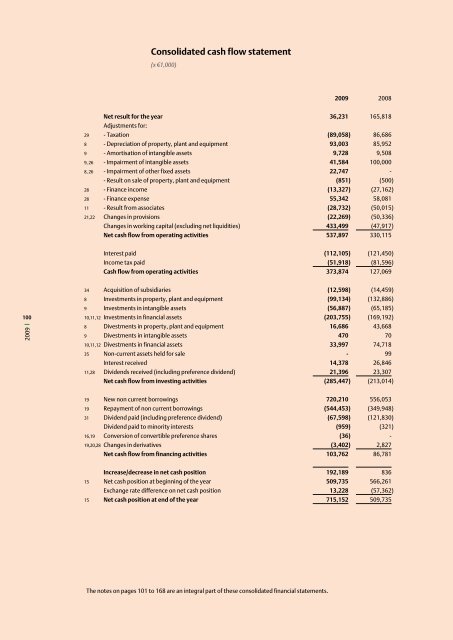
Consolidated cash flow statement<br />
(x €1,000)<br />
Net result for the year<br />
Adjustments for:<br />
- Taxation<br />
- Depreciation of property, plant and equipment<br />
- Amortisation of intangible assets<br />
- Impairment of intangible assets<br />
- Impairment of other fixed assets<br />
- Result on sale of property, plant and equipment<br />
- Finance income<br />
- Finance expense<br />
- Result from associates<br />
Changes in provisions<br />
Changes in working capital (excluding net liquidities)<br />
Net cash flow from operating activities<br />
Interest paid<br />
Income tax paid<br />
Cash flow from operating activities<br />
34 Acquisition of subsidiaries<br />
8 I<strong>nv</strong>estments in property, plant and equipment<br />
9 I<strong>nv</strong>estments in intangible assets<br />
10,11,12 I<strong>nv</strong>estments in financial assets<br />
8 Divestments in property, plant and equipment<br />
9 Divestments in intangible assets<br />
10,11,12 Divestments in financial assets<br />
35 Non-current assets held for sale<br />
Interest received<br />
11,28 Dividends received (including preference dividend)<br />
Net cash flow from i<strong>nv</strong>esting activities<br />
19 New non current borrowings<br />
19 Repayment of non current borrowings<br />
31 Dividend paid (including preference dividend)<br />
Dividend paid to minority interests<br />
16,19 Co<strong>nv</strong>ersion of co<strong>nv</strong>ertible preference shares<br />
19,20,28 Changes in derivatives<br />
Net cash flow from financing activities<br />
15<br />
15<br />
Increase/decrease in net cash position<br />
Net cash position at beginning of the year<br />
Exchange rate difference on net cash position<br />
Net cash position at end of the year<br />
The notes on pages 101 to 168 are an integral part of these consolidated financial statements.<br />
<strong>2009</strong><br />
36,231<br />
(89,058)<br />
93,003<br />
9,728<br />
41,584<br />
22,747<br />
(851)<br />
(13,327)<br />
55,342<br />
(28,732)<br />
(22,269)<br />
433,499<br />
537,897<br />
(112,105)<br />
(51,918)<br />
373,874<br />
(12,598)<br />
(99,134)<br />
(56,887)<br />
(203,755)<br />
16,686<br />
470<br />
33,997<br />
-<br />
14,378<br />
21,396<br />
(285,447)<br />
720,210<br />
(544,453)<br />
(67,598)<br />
(959)<br />
(36)<br />
(3,402)<br />
103,762<br />
192,189<br />
509,735<br />
13,228<br />
715,152<br />
2008<br />
165,818<br />
86,686<br />
85,952<br />
9,508<br />
100,000<br />
-<br />
(500)<br />
(27,162)<br />
58,081<br />
(50,015)<br />
(50,336)<br />
(47,917)<br />
330,115<br />
(121,450)<br />
(81,596)<br />
127,069<br />
(14,459)<br />
(132,886)<br />
(65,185)<br />
(169,192)<br />
43,668<br />
70<br />
74,718<br />
99<br />
26,846<br />
23,307<br />
(213,014)<br />
556,053<br />
(349,948)<br />
(121,830)<br />
(321)<br />
-<br />
2,827<br />
86,781<br />
836<br />
566,261<br />
(57,362)<br />
509,735