The Trucker Newspaper - November 1, 2018
Create successful ePaper yourself
Turn your PDF publications into a flip-book with our unique Google optimized e-Paper software.
THETRUCKER.COM<br />
b Congestion from page 1 b<br />
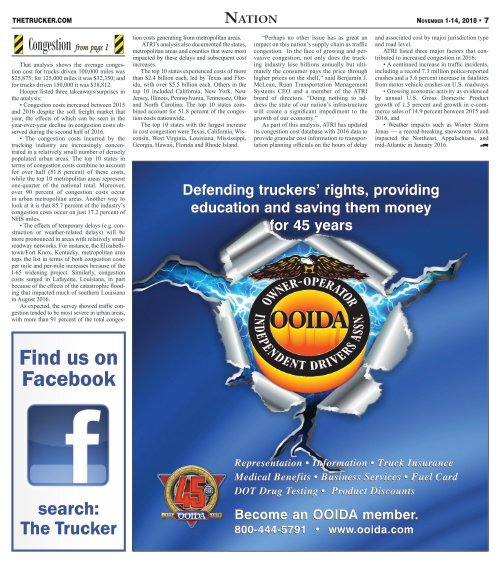
That analysis shows the average congestion<br />
cost for trucks driven 100,000 miles was<br />
$25,875; for 125,000 miles it was $32,350; and<br />
for trucks driven 150,000 it was $38,812.<br />
Hooper listed three takeaways/surprises in<br />
the analysis:<br />
• Congestion costs increased between 2015<br />
and 2016 despite the soft freight market that<br />
year, the effects of which can be seen in the<br />
year-over-year decline in congestion costs observed<br />
during the second half of 2016.<br />
• <strong>The</strong> congestion costs incurred by the<br />
trucking industry are increasingly concentrated<br />
in a relatively small number of densely<br />
populated urban areas. <strong>The</strong> top 10 states in<br />
terms of congestion costs combine to account<br />
for over half (51.8 percent) of these costs,<br />
while the top 10 metropolitan areas represent<br />
one-quarter of the national total. Moreover,<br />
over 90 percent of congestion costs occur<br />
in urban metropolitan areas. Another way to<br />
look at it is that 85.7 percent of the industry’s<br />
congestion costs occur on just 17.2 percent of<br />
NHS miles.<br />
• <strong>The</strong> effects of temporary delays (e.g. construction<br />
or weather-related delays) will be<br />
more pronounced in areas with relatively small<br />
roadway networks. For instance, the Elizabethtown/Fort<br />
Knox, Kentucky, metropolitan area<br />
tops the list in terms of both congestion costs<br />
per mile and per-mile increases because of the<br />
I-65 widening project. Similarly, congestion<br />
costs surged in Lafayette, Louisiana, in part<br />
because of the effects of the catastrophic flooding<br />
that impacted much of southern Louisiana<br />
in August 2016.<br />
As expected, the survey showed traffic congestion<br />
tended to be most severe in urban areas,<br />
with more than 91 percent of the total congestion<br />
costs generating from metropolitan areas.<br />
ATRI’s analysis also documented the states,<br />
metropolitan areas and counties that were most<br />
impacted by these delays and subsequent cost<br />
increases.<br />
<strong>The</strong> top 10 states experienced costs of more<br />
than $2.4 billion each, led by Texas and Florida,<br />
with over $5.5 billion each. Others in the<br />
top 10 included California, New York, New<br />
Jersey, Illinois, Pennsylvania, Tennessee, Ohio<br />
and North Carolina. <strong>The</strong> top 10 states combined<br />
account for 51.8 percent of the congestion<br />
costs nationwide.<br />
<strong>The</strong> top 10 states with the largest increase<br />
in cost congestion were Texas, California, Wisconsin,<br />
West Virginia, Louisiana, Mississippi,<br />
Georgia, Hawaii, Florida and Rhode Island.<br />
Nation <strong>November</strong> 1-14, <strong>2018</strong> • 7<br />
“Perhaps no other issue has as great an<br />
impact on this nation’s supply chain as traffic<br />
congestion. In the face of growing and pervasive<br />
congestion, not only does the trucking<br />
industry lose billions annually but ultimately<br />
the consumer pays the price through<br />
higher prices on the shelf,” said Benjamin J.<br />
McLean, Ruan Transportation Management<br />
Systems CEO and a member of the ATRI<br />
board of directors. “Doing nothing to address<br />
the state of our nation’s infrastructure<br />
will create a significant impediment to the<br />
growth of our economy.”<br />
As part of this analysis, ATRI has updated<br />
its congestion cost database with 2016 data to<br />
provide granular cost information to transportation<br />
planning officials on the hours of delay<br />
and associated cost by major jurisdiction type<br />
and road level.<br />
ATRI listed three major factors that contributed<br />
to increased congestion in 2016:<br />
• A continued increase in traffic incidents,<br />
including a record 7.3 million police-reported<br />
crashes and a 5.6 percent increase in fatalities<br />
from motor vehicle crashes on U.S. roadways<br />
• Growing economic activity as evidenced<br />
by annual U.S. Gross Domestic Product<br />
growth of 1.5 percent and growth in e-commerce<br />
sales of 14.9 percent between 2015 and<br />
2016, and<br />
• Weather impacts such as Winter Storm<br />
Jonas — a record-breaking snowstorm which<br />
impacted the Northeast, Appalachians, and<br />
mid-Atlantic in January 2016. 8<br />
Defending truckers’ rights, providing<br />
education and saving them money<br />
for 45 years<br />
Find us on<br />
Facebook<br />
search:<br />
<strong>The</strong> <strong>Trucker</strong><br />
Representation • Information • Truck Insurance<br />
Medical Benefits • Business Services • Fuel Card<br />
DOT Drug Testing • Product Discounts<br />
Become an OOIDA member.<br />
800-444-5791 • www.ooida.com


