Staatsolie Annual Report 2017

Create successful ePaper yourself
Turn your PDF publications into a flip-book with our unique Google optimized e-Paper software.
<strong>Annual</strong> <strong>Report</strong> <strong>2017</strong> 103<br />
<strong>Staatsolie</strong> Maatschappij Suriname N.V.<br />
Notes to the Consolidated financial statements for the years ended December 31, <strong>2017</strong> and 2016<br />
(continued)<br />
<strong>Staatsolie</strong> Maatschappij Suriname N.V.<br />
Inventories Notes the are Consolidated stated at financial the lower statements of cost and for the net years realizable ended value. December Net 31, realizable <strong>2017</strong> and value 2016 is (continued) the estimated<br />
selling price in the ordinary course of business, less estimated costs of completion and the estimated<br />
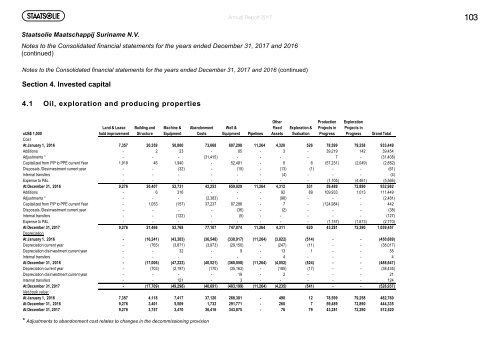
Section 4. Invested capital<br />
costs to sell.<br />
The 4.1 cost Oil, of exploration crude oil and refined and producing products is properties<br />
the purchase cost, the cost of refining, including the<br />
appropriate proportion of depreciation, depletion and amortization and overheads based on normal<br />
operating capacity, determined Land on & Lease a weighted Building and average Machine basis. & Abandonment<br />
Well &<br />
Exploration &<br />
xUS$ 1,000<br />
hold improvement Structure Equipment Costs Equipment Pipelines<br />
Evaluation<br />
Grand Total<br />
Cost<br />
At January 1, 2016 7,357 20,359 50,800 73,668 607,298 11,264 4,320 526 78,599 79,258 933,449<br />
Additions - 2 23 - 65 - 3 - 39,219 142 39,454<br />
Adjustments * - - - (31,415) - - - - 7 - (31,408)<br />
Capitalized from PIP to PPE current Year 1,919 46 1,940 - 52,481 - 6 6 (57,231) (2,049) (2,882)<br />
The net realizable value of crude oil and refined products is based on the estimated selling price in the<br />
ordinary course of business, less the estimated costs of completion and the estimated costs necessary to<br />
make the sale.<br />
Materials and supplies are valued using the weighted average cost method.<br />
Pipeline fill<br />
Crude oil, which is necessary to bring a pipeline into working order, is treated as a part of the related<br />
pipeline. This is on the basis that it is not held for sale or consumed in a production process, but is<br />
Depreciation<br />
necessary to the operation of a facility during more than one operating cycle, and its cost cannot be<br />
recouped through sale (or is significantly impaired). This applies even if the part of inventory that is<br />
deemed to be an item of property, plant and equipment cannot be separated physically from the rest of<br />
inventory. It is valued at cost and is depreciated over the useful life of the related asset.<br />
Net book value: n. Impairment of non-financial assets<br />
The Group assesses at each reporting date whether there is an indication that an asset may be impaired.<br />
If any indication exists, or when annual impairment testing for an asset is required, the Group estimates<br />
* Adjustments to abandonment cost relates to changes in the decommissioning provision<br />
the asset’s recoverable amount. An asset’s recoverable amount is the higher of an asset’s or cash<br />
generating units (CGU) fair value less costs of disposal and its value in use. It is determined for an<br />
individual asset, unless the asset does not generate cash inflows that are largely independent of those<br />
Other<br />
Fixed<br />
Assets<br />
Production<br />
Projects in<br />
Progress<br />
Exploration<br />
Projects in<br />
Progress<br />
Disposals /Desinvestment current year - - (32) - (15) - (13) (1) - - (61)<br />
Internal transfers - - - - - - (4) - - - (4)<br />
Expense to P&L - - - - - - - - (1,105) (4,461) (5,566)<br />
At December 31, 2016 9,276 20,407 52,731 42,253 659,829 11,264 4,312 531 59,489 72,890 932,982<br />
Additions - 6 316 - - - 92 89 109,933 1,013 111,449<br />
Adjustments * - - - (2,383) - - (98) - - - (2,481)<br />
Capitalized from PIP to PPE current Year - 1,053 (157) 37,237 87,286 - 7 - (124,984) - 442<br />
Disposals /Desinvestment current year - - - - (36) - (2) - - - (38)<br />
Internal transfers - - (122) - (5) - - - - - (127)<br />
Expense to P&L - - - - - - - - (1,157) (1,613) (2,770)<br />
At December 31, <strong>2017</strong> 9,276 21,466 52,768 77,107 747,074 11,264 4,311 620 43,281 72,290 1,039,457<br />
At January 1, 2016 - (16,241) (43,383) (36,548) (338,917) (11,264) (3,822) (514) - - (450,689)<br />
Depreciation current year - (765) (3,871) (3,973) (29,150) - (247) (11) - - (38,017)<br />
Depreciation disinvestment current year - - 32 - 9 - 13 1 - - 55<br />
Internal transfers - - - - - - 4 - - - 4<br />
At December 31, 2016 - (17,006) (47,222) (40,521) (368,058) (11,264) (4,052) (524) - - (488,647)<br />
Depreciation current year - (703) (2,197) (170) (35,163) - (185) (17) - - (38,435)<br />
Depreciation disinvestment current year - - - - 19 - 2 - - - 21<br />
Internal transfers - - 121 - 3 - - - - - 124<br />
At December 31, <strong>2017</strong> - (17,709) (49,298) (40,691) (403,199) (11,264) (4,235) (541) - - (526,937)<br />
At January 1, 2016 7,357 4,118 7,417 37,120 268,381 - 498 12 78,599 79,258 482,760<br />
At December 31, 2016 9,276 3,401 5,509 1,732 291,771 - 260 7 59,489 72,890 444,335<br />
At December 31, <strong>2017</strong> 9,276 3,757 3,470 36,416 343,875 - 76 79 43,281 72,290 512,520