Bauhaus Luftfahrt Jahrbuch 2018

You also want an ePaper? Increase the reach of your titles
YUMPU automatically turns print PDFs into web optimized ePapers that Google loves.
25<br />
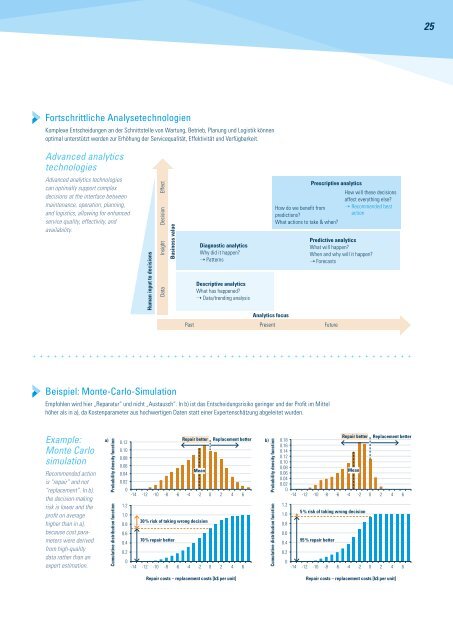
Fortschrittliche Analysetechnologien<br />
Komplexe Entscheidungen an der Schnittstelle von Wartung, Betrieb, Planung und Logistik können<br />
optimal unterstützt werden zur Erhöhung der Servicequalität, Effektivität und Verfügbarkeit.<br />
Advanced analytics<br />
technologies<br />
Advanced analytics technologies<br />
can optimally support complex<br />
decisions at the interface between<br />
maintenance, operation, planning,<br />
and logistics, allowing for enhanced<br />
service quality, effectivity, and<br />
availability.<br />
Human input to decisions<br />
Data Insight Decision Effect<br />
Business value<br />
Diagnostic analytics<br />
Why did it happen?<br />
➝ Patterns<br />
Descriptive analytics<br />
What has happened?<br />
➝ Data/trending analysis<br />
Prescriptive analytics<br />
How do we benefit from<br />
predictions?<br />
What actions to take & when?<br />
How will these decisions<br />
affect everything else?<br />
➝ Recommended best<br />
action<br />
Predictive analytics<br />
What will happen?<br />
When and why will it happen?<br />
➝ Forecasts<br />
Analytics focus<br />
Past<br />
Present<br />
Future<br />
+ + + + + + + + + + + + + + + + + + + + + + + + + + + + + + + + + + + + + + + + + + + + + + + + + + + + + +<br />
Beispiel: Monte-Carlo-Simulation<br />
Empfohlen wird hier „Reparatur“ und nicht „Austausch“. In b) ist das Entscheidungsrisiko geringer und der Profit im Mittel<br />
höher als in a), da Kostenparameter aus hochwertigen Daten statt einer Expertenschätzung abgeleitet wurden.<br />
Example:<br />
Monte Carlo<br />
simulation<br />
Recommended action<br />
is “repair” and not<br />
“replacement”. In b),<br />
the decision-making<br />
risk is lower and the<br />
profit on average<br />
higher than in a),<br />
because cost parameters<br />
were derived<br />
from high-quality<br />
data rather than an<br />
expert estimation.<br />
a)<br />
Probability density function<br />
Cumulative distribution function<br />
0.12<br />
0.10<br />
0.08<br />
0.06<br />
0.04<br />
0.02<br />
0<br />
1.2<br />
1.0<br />
0.8<br />
0.6<br />
0.4<br />
0.2<br />
0<br />
Repair better Replacement better<br />
Mean<br />
-14 -12 -10 -8 -6 -4 -2 0 2 4 6<br />
30 % risk of taking wrong decision<br />
70 % repair better<br />
-14 -12 -10 -8 -6 -4 -2 0 2 4 6<br />
b)<br />
Probability density function<br />
Cumulative distribution function<br />
0.18<br />
0.16<br />
0.14<br />
0.12<br />
0.10<br />
0.08<br />
0.06<br />
0.04<br />
0.02<br />
0<br />
1.2<br />
1.0<br />
0.8<br />
0.6<br />
0.4<br />
0.2<br />
5 % risk of taking wrong decision<br />
95 % repair better<br />
Repair better<br />
Mean<br />
Replacement better<br />
-14 -12 -10 -8 -6 -4 -2 0 2 4 6<br />
0<br />
-14 -12 -10 -8 -6 -4 -2 0 2 4 6<br />
Repair costs – replacement costs [k$ per unit]<br />
Repair costs – replacement costs [k$ per unit]