TLA32_AllPages_R

Create successful ePaper yourself
Turn your PDF publications into a flip-book with our unique Google optimized e-Paper software.
CAPITOL RECAP<br />
A review of important news coming out of our nation’s capital.<br />
By Lyndon Finney, Klint Lowry and Dorothy Cox<br />
With ELDs done and dusted, the Federal Motor Carrier Safety Administration says from their CMV inspections, the rate of<br />
compliance was 99.14 percent, making it pretty much “universal.” Now it’s time to mine the ELD data to drive more change for the<br />
better, from needed HOS flexibility to flagrant detention time scofflaws. It appears more changes are in the offing for CSA, as FMCSA<br />
withdrew its latest changes so it can concentrate on an overhaul recommended by the National Academy of Sciences. And speaking of<br />
overhauls, FMCSA and state agencies are working on getting their computer systems upgraded. Meanwhile, the trucking industry is<br />
still battling tolls and freight is still booming. But will it continue to boom? That and more are explored in this latest Capitol Recap.<br />
‘UNIVERSAL’ ELD COMPLIANCE<br />
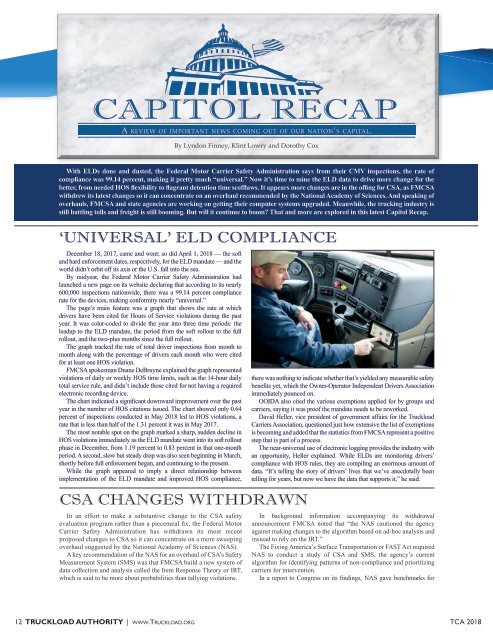
December 18, 2017, came and went; so did April 1, 2018 — the soft<br />
and hard enforcement dates, respectively, for the ELD mandate — and the<br />
world didn’t orbit off its axis or the U.S. fall into the sea.<br />
By midyear, the Federal Motor Carrier Safety Administration had<br />
launched a new page on its website declaring that according to its nearly<br />
600,000 inspections nationwide, there was a 99.14 percent compliance<br />
rate for the devices, making conformity nearly “universal.”<br />
The page’s main feature was a graph that shows the rate at which<br />
drivers have been cited for Hours of Service violations during the past<br />
year. It was color-coded to divide the year into three time periods: the<br />
leadup to the ELD mandate, the period from the soft rollout to the full<br />
rollout, and the two-plus months since the full rollout.<br />
The graph tracked the rate of total driver inspections from month to<br />
month along with the percentage of drivers each month who were cited<br />
for at least one HOS violation.<br />
FMCSA spokesman Duane DeBruyne explained the graph represented<br />
violations of daily or weekly HOS time limits, such as the 14-hour daily<br />
total service rule, and didn’t include those cited for not having a required<br />
electronic recording device.<br />
The chart indicated a significant downward improvement over the past<br />
year in the number of HOS citations issued. The chart showed only 0.64<br />
percent of inspections conducted in May 2018 led to HOS violations, a<br />
rate that is less than half of the 1.31 percent it was in May 2017.<br />
The most notable spot on the graph marked a sharp, sudden decline in<br />
HOS violations immediately as the ELD mandate went into its soft rollout<br />
phase in December, from 1.19 percent to 0.83 percent in that one-month<br />
period. A second, slow but steady drop was also seen beginning in March,<br />
shortly before full enforcement began, and continuing to the present.<br />
While the graph appeared to imply a direct relationship between<br />
implementation of the ELD mandate and improved HOS compliance,<br />
CSA CHANGES WITHDRAWN<br />
In an effort to make a substantive change to the CSA safety<br />
evaluation program rather than a piecemeal fix, the Federal Motor<br />
Carrier Safety Administration has withdrawn its most recent<br />
proposed changes to CSA so it can concentrate on a more sweeping<br />
overhaul suggested by the National Academy of Sciences (NAS).<br />
A key recommendation of the NAS for an overhaul of CSA’s Safety<br />
Measurement System (SMS) was that FMCSA build a new system of<br />
data collection and analysis called the Item Response Theory or IRT,<br />
which is said to be more about probabilities than tallying violations.<br />
there was nothing to indicate whether that’s yielded any measurable safety<br />
benefits yet, which the Owner-Operator Independent Drivers Association<br />
immediately pounced on.<br />
OOIDA also cited the various exemptions applied for by groups and<br />
carriers, saying it was proof the mandate needs to be reworked.<br />
David Heller, vice president of government affairs for the Truckload<br />
Carriers Association, questioned just how extensive the list of exemptions<br />
is becoming and added that the statistics from FMCSA represent a positive<br />
step that is part of a process.<br />
The near-universal use of electronic logging provides the industry with<br />
an opportunity, Heller explained. While ELDs are monitoring drivers’<br />
compliance with HOS rules, they are compiling an enormous amount of<br />
data. “It’s telling the story of drivers’ lives that we’ve anecdotally been<br />
telling for years, but now we have the data that supports it,” he said.<br />
In background information accompanying its withdrawal<br />
announcement FMCSA noted that “the NAS cautioned the agency<br />
against making changes to the algorithm based on ad-hoc analysis and<br />
instead to rely on the IRT.”<br />
The Fixing America’s Surface Transportation or FAST Act required<br />
NAS to conduct a study of CSA and SMS, the agency’s current<br />
algorithm for identifying patterns of non-compliance and prioritizing<br />
carriers for intervention.<br />
In a report to Congress on its findings, NAS gave benchmarks for<br />
12 TRUCKLOAD AUTHORITY | www.Truckload.org TCA 2018