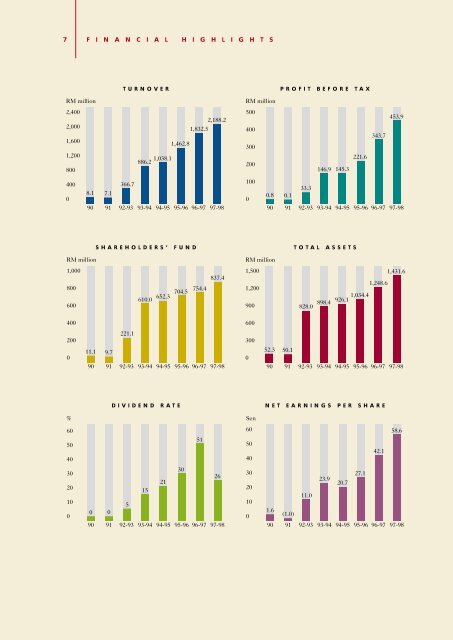
Before Change in After change in Shareholding+ Shareholding+ Description 1997/98 1997/98 1996/97 1995/96 1994/95 1993/94 1992/93 (16 Months) 1991 1990 US$’000 RM’000 RM’000 RM’000 RM’000 RM’000 RM’000 RM’000 RM’000 Turnover 575,852 2,188,238 1,832,510 1,462,809 1,038,070 886,198 366,683 7,148 8,153 Profit before taxation 119,454 453,925 343,691 221,557 145,292 146,912 33,293 128 756 Profit/(Loss) after taxation Profit/(Loss) attributable 88,000 334,400 238,474 150,871 111,894 99,567 12,230 (331) 536 to shareholders 88,000 334,400 238,323 149,462 104,821 94,646 10,366 (307) 536 Share Capital 150,611 572,322 568,197 561,649 549,271 533,154 243,000 33,970 33,970 Share Premium 21,222 80,642 76,349 68,860 61,300 58,030 - - - Reserves 48,529 184,408 109,832 73,950 41,762 18,832 (21,942) (24,289) (22,913) Shareholders’ Fund 220,362 837,372 754,378 704,459 652,333 610,016 221,058 9,681 11,057 Deferred Liabilities 8,732 33,180 36,953 28,207 24,597 27,308 19,014 - 250 Current Liabilities 9% Redeemable Convertible Unsecured 147,645 561,050 452,715 291,241 225,665 218,287 197,000 40,378 41,008 Loan Stocks 1992/1997 - - 4,515 10,525 23,463 42,786 390,970 - - 376,739 1,431,602 1,248,561 1,034,432 926,058 898,397 828,042 50,059 52,315 Fixed Assets 19,778 75,155 44,832 41,218 40,226 40,297 27,208 180 115 Intangible Assets 144,184 547,901 547,901 547,901 547,901 547,901 546,101 215 215 Investments 19,036 72,335 41,279 39,036 17,330 29,001 13,686 15,549 15,053 Current Assets 193,741 736,211 614,549 406,277 320,601 281,198 241,047 34,115 36,932 Total Assets 376,739 1,431,602 1,248,561 1,034,432 926,058 898,397 828,042 50,059 52,315 Net Tangible Assets per share (cents/sen) Net Assets 13.3 50.6 36.3 27.9 19.0 11.7 (133.8) 27.9 31.9 per share (cents/sen) Gross Earnings 38.5 146.3 132.8 125.4 118.8 114.4 91.0 28.5 32.5 per share (cents/sen) Net Earnings/(Loss) 20.9 79.3 60.7 39.9 26.9 35.3 29.9 0.4 2.3 per share (cents/sen) 15.4 58.6 42.1 27.1 20.7 23.9 11.0 (1.0) 1.6 Dividend Rate (%) Dividend Amount 26 26 51 30 21 15 5 - - (US$’000/RM’000) 28,226 107,260 202,753 117,653 80,552 54,069 8,019 - - NOTE: 6 G R O U P F I N A N C I A L S U M M A R Y Figures for 1990 and 1991 are for the year ended 31 December; figures for 1992/1993 are for the 16 months’ period ended 30 April 1993; figures for 1993/1994 to 1997/1998 are for 12 months ended 30 April. Where additional shares are issued, the earnings per share are calculated on a weighted average number of shares. Exchange rate: US$1.00 = RM3.80 + change in shareholding relates to the major change in directorate and direction of the Company.
7 F I N A N C I A L H I G H L I G H T S TURNOVER PROFIT BEFORE TAX SHAREHOLDERS’ FUND TOTAL ASSETS DIVIDEND RATE NET EARNINGS PER SHARE