Asian Sky Quarterly 2021Q1

Create successful ePaper yourself
Turn your PDF publications into a flip-book with our unique Google optimized e-Paper software.
FIRST QUARTER 2021<br />
THE NEW BATTLEGROUND –<br />
ULTRA LONG-RANGE JETS<br />
G700, GLOBAL 7500 & FALCON 10X<br />
INTERVIEWS<br />
SINO JET<br />
COMLUX<br />
COMMENTARY<br />
CLYDE & CO<br />
GLOBAL JET CAPITAL<br />
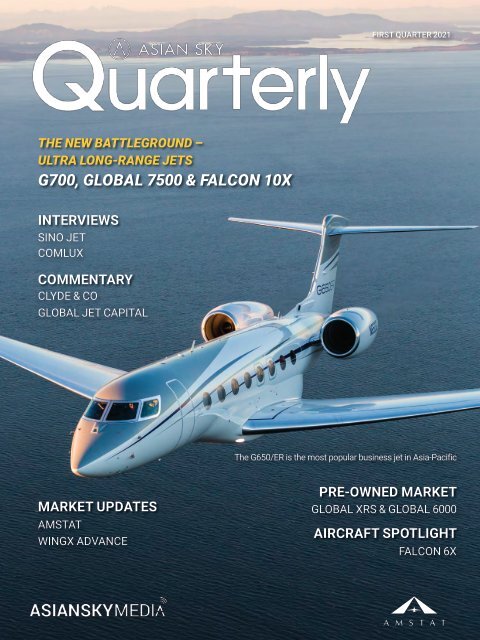
The G650/ER is the most popular business jet in Asia-Pacific<br />
MARKET UPDATES<br />
AMSTAT<br />
WINGX ADVANCE<br />
PRE-OWNED MARKET<br />
GLOBAL XRS & GLOBAL 6000<br />
AIRCRAFT SPOTLIGHT<br />
FALCON 6X<br />
FIRST QUARTER 2021 — ASIAN SKY QUARTERLY | I
II | ASIAN SKY QUARTERLY — FIRST QUARTER 2021
CONTENTS<br />
04<br />
ECONOMICS<br />
Overview of Asia-Pacific’s current status, as well as country<br />
specific data that measures GDP against business jet and<br />
helicopter fleets.<br />
28<br />
EXCLUSIVE<br />
THE NEW BATTLEGROUND – ULTRA LONG-RANGE JETS<br />
GULFSTREAM G700, GLOBAL 7500 & FALCON 10X<br />
10<br />
16<br />
MOOD & INTENTIONS<br />
Results of our survey on the Asia-Pacific region’s outlook on<br />
economic status, aircraft utilization, purchase intentions and<br />
influencing factors.<br />
COMMENTARY<br />
CLYDE & CO | DEFAULTS, RECOVERIES &<br />
OPPORTUNITIES IN BUSINESS AVIATION<br />
Peter Coles and Stuart Miller of Clyde & Co, talk us through<br />
how to avoid high tensions during a default or recovery<br />
32<br />
40<br />
44<br />
SPECIAL FEATURE<br />
WINGX ADVANCE |ASIA-PACIFIC BUSINESS JET<br />
FLIGHT ACTIVITY<br />
PRE-OWNED MARKET SPOTLIGHT<br />
GLOBAL XRS AND GLOBAL 6000<br />
MARKET UPDATE<br />
AMSTAT |GLOBAL MARKET UPDATE Q1 2021<br />
20<br />
24<br />
INTERVIEW<br />
SINO JET | ROSELLE WONG , DIRECTOR OF<br />
SERVICE DELIVERY<br />
Sino Jet’s Director of Service Delivery Roselle Wong talks us<br />
through how the company fared in 2020, as well as giving us<br />
a sneak peak into Sino Jet’s future plans.<br />
COMLUX | DARON DRYER, CEO OF<br />
COMLUX COMPLETION<br />
<strong>Asian</strong> <strong>Sky</strong> Media caught up Comlux Completion’s CEO Daron<br />
Dryer to talk through the processes it takes to complete an<br />
Airbus ACJ TwoTwenty – an industry first.<br />
46<br />
52<br />
60<br />
COMMENTARY<br />
GLOBAL JET CAPITAL |Q4 2020 - GLOBAL<br />
MARKET UPDATE<br />
MARKET DYNAMICS<br />
An analysis of APAC inventory levels, market trends and the<br />
changing price signals for the business jet and helicopter fleets.<br />
MARKET SUMMARY - JETS<br />
A look at market position and average days on market of<br />
featured pre-owned business jets.<br />
26<br />
AIRCRAFT SPOTLIGHT<br />
FIRST FLIGHT: DASSAULT FALCON 6X<br />
Dassault talks us through the first flight of its Falcon 6X, as<br />
well as the preparations it is making for the aircraft’s entry<br />
into service.<br />
77<br />
MARKET SUMMARY – HELICOPTERS<br />
A look at market position and average days on market of<br />
featured pre-owned helicopters.<br />
PUBLISHER<br />
EDITORIAL & MARKET RESEARCH<br />
Alud Davies<br />
Bowen Zhang<br />
Coco Yang<br />
Wyatt Tang<br />
DESIGN<br />
Lottie Yu<br />
The materials and information provided by <strong>Asian</strong> <strong>Sky</strong> Group<br />
Limited (“ASG”) in this report is for reference only. Any<br />
information we provide about how we may interpret the data<br />
and market, or how certain issues may be addressed is provided<br />
generally without considering your specific circumstances.<br />
Such information should not be regarded as a substitute for<br />
professional advice. Independent professional advice should be<br />
sought before taking action on any matters to which information<br />
provided in this report may be relevant.<br />
ASG shall not be liable for any losses, damage, costs or<br />
expenses howsoever caused, arising directly or indirectly from<br />
the use of or inability to use this report or use of or reliance upon<br />
any information or material provided in this report or otherwise<br />
in connection with any representation, statement or information<br />
on or contained in this report.<br />
ASG endeavors to ensure that the information contained in<br />
this report is accurate as at the date of publication, but does<br />
not guarantee or warrant its accuracy or completeness, or<br />
accept any liability of whatever nature for any losses, damage,<br />
costs or expenses howsoever caused, whether arising directly<br />
or indirectly from any error or omission in compiling such<br />
information. This report also uses third party information not<br />
compiled by ASG. ASG is not responsible for such information<br />
and makes no representation about the accuracy, completeness<br />
or any other aspect of information contained. The information,<br />
data, articles, or resources provided by any other parties do not<br />
in any way signify that ASG endorses the same.<br />
ADVERTISING/AIRCRAFT SALES ENQUIRIES:<br />
sales@asianskygroup.com<br />
<strong>Asian</strong> <strong>Sky</strong> Group<br />
Tel: (852) 9199 7751<br />
sales@asianskygroup.com<br />
www.asianskygroup.com | www.asianskymedia.com<br />
FIRST QUARTER 2021 — ASIAN SKY QUARTERLY | 1
EDITOR’S NOTE<br />
There is some bad news, and good news with<br />
this issue of <strong>Asian</strong> <strong>Sky</strong> <strong>Quarterly</strong>. The bad<br />
news is that we are a little later than usual<br />
publishing (see page 28 for the reason why<br />
we held on a little longer than normal before<br />
going to press), but the good news is that<br />
the economic and industry recovery that we<br />
started seeing in the previous edition has<br />
continued into the first quarter of 2021.<br />
This could have been predicted by our Mood and Intentions survey, which<br />
for the past few issues has seen an increasingly positive mood creeping<br />
back into the industry. This survey is one of the most important, and most<br />
respected, sections of <strong>Asian</strong> <strong>Sky</strong> <strong>Quarterly</strong>. It is also, in many cases, the<br />
section that people turn to first when reading the magazine.<br />
It is not hard to see why. The data that we report each issue lets people<br />
understand what has been happening in the industry, but the Moods and<br />
Intentions survey shows how people are thinking, and can often be seen as<br />
an early indication on the direction that the market is heading in.<br />
Take the results from the optimism on economic status that we ran at<br />
the end of the first quarter of 2020 as an example. Whilst you might be<br />
tempted to find the nearest cliff to run and take a jump from, this was<br />
at the height of the first wave of the pandemic's seemingly unstoppable<br />
march around the world. At that stage, nobody knew what would happen,<br />
panic had well and truly set in, and countries around the world were sealing<br />
themselves off from the rest of the world to keep the virus out as much as<br />
they could. Scheduled airline flights were slashed, and even if you did have<br />
access to a private jet, the places you could visit were limited to a handful<br />
of countries that were still open to some degree. Optimism in the industry<br />
was low, and understandably so.<br />
But by the time we surveyed people again for the second quarter of 2020,<br />
we were already beginning to see some optimism return, especially in<br />
Greater China and Oceania. For the rest of the Asia-Pacific region, this was<br />
the low point, but from the second half of the year, optimism returned for<br />
all regions. In many cases, the level of optimism that we are seeing now is<br />
the highest it has been since 2018.<br />
As this optimism transitioned throughout the latter part of the 2020, it<br />
translated from intentions to actions, and we saw more aircraft flying and<br />
more pre-owned transactions taking place. And that is exactly what the<br />
survey is intended to do. It is intended to be a signal, an early indicator<br />
of the direction that the industry will take. And the good news, is that all<br />
signals from the first quarter of 2021 are looking positive so far.<br />
As well as the usual surveys and market updates, this edition of <strong>Asian</strong><br />
<strong>Sky</strong> <strong>Quarterly</strong> includes a special feature on the ultra-long-range sector,<br />
with our originally scheduled publishing date being retimed to include<br />
Dassault’s recently launched Falcon 10X. Elsewhere, we have interviews<br />
with and articles from Sino Jet’s Roselle Wong on how 2020 was for<br />
the company, Peter Coles and Stuart Miller of Clyde & Co on defaults,<br />
recoveries and opportunities, Daron Dryer of Comlux Completion on the<br />
work involved in completing the cabin of the first Airbus ACJ TwoTwenty,<br />
and Dassault, which talks us through the progress it is making with the<br />
flight test campaign for the Falcon 6X. We round off the issue by turning<br />
the spotlight on the Global XRS and Global 6000 pre-owned market.<br />
As always, we would like to thank Global Jet Capital, WingX Advance, and<br />
AMSTAT for graciously supply data and commentary for this edition.<br />
Sincerely,<br />
Alud Davies<br />
Media & Communications Director, <strong>Asian</strong> <strong>Sky</strong> Group<br />
SPECIAL THANKS TO OUR CONTRIBUTORS:<br />
2 | ASIAN SKY QUARTERLY — FIRST QUARTER 2021
THE GULFSTREAM<br />
DIFFERENCE<br />
Your mission is our inspiration. Every investment we<br />
make—in advanced technology, precision manufacturing<br />
and worldwide customer support—is an investment in you.<br />
FIRST QUARTER 2021 — ASIAN SKY QUARTERLY | 3
ASIA-PACIFIC REGION<br />
BUSINESS JETS<br />
THE FALCON 10X -<br />
IN DASSAULT’S OWN WORDS<br />
COVER FEATURE<br />
YE 2020<br />
ECONOMICS<br />
NOW AVAILABLE<br />
A COMPREHENSIVE COVERAGE AND<br />
BREAKDOWN OF THE BUSINESS JET FLEET<br />
IN THE ASIA PACIFIC REGION.<br />
MARKET UPDATES BY<br />
OPERATOR<br />
AIRCRAFT REGISTRY<br />
OEM<br />
ENGINE<br />
PRODUCT SPOTLIGHTS<br />
& INTERVIEWS<br />
SPECIAL FEATURES<br />
COVID-19 IMPACT<br />
CABIN CONNECTIVITY<br />
01<br />
ASIA - PACIFIC BUSINE S JET FL ET REPORT – YEAR END 2020<br />
GREATER CHINA | MAINLAND CHINA, HONG KONG, MACAU & TAIWAN<br />
Mainland China<br />
China’s economy expanded by 2.3% in 2020. Although it<br />
was the lowest growth the country has seen since 1976,<br />
it was still the only major global economy to grow during<br />
the year. The momentum from the second half of the year<br />
is expected to continue into 2021, with the IMF forecasting<br />
growth of 8.1% for the year.<br />
Hong Kong, China<br />
Hong Kong’s economy shrank by 6.1% in 2020 – the steepest<br />
decline it had ever recorded. Blamed largely on the<br />
COVID-19 pandemic, private consumption expenditure was<br />
at its lowest levels ever, as uncertainty around economic<br />
conditions and a deteriorating job market took their toll on<br />
public confidence.<br />
Taiwan, China<br />
Taiwan’s economy expanded by 2.98% in 2020 – the first<br />
time that the country’s growth outpaced China’s. The rise<br />
was largely due to increased exports, specifically Taiwanese<br />
electronics, as well as an increase in domestic consumer<br />
spending.<br />
*Data Source : Trading Economics<br />
*Macau’s PMI is not available.<br />
A reading above 50 indicates an expansion of the manufacturing sector compared to<br />
the previous month; below 50 represents a contraction; while 50 indicates no change.<br />
FLEET SIZE GROWTH<br />
GDP GROWTH (BILLION USD)<br />
$11,016<br />
64.0%<br />
62.0%<br />
60.0%<br />
58.0%<br />
56.0%<br />
54.0%<br />
52.0%<br />
50.0%<br />
48.0%<br />
46.0%<br />
44.0%<br />
42.0%<br />
40.0%<br />
38.0%<br />
36.0%<br />
34.0%<br />
32.0%<br />
30.0%<br />
$525<br />
$309<br />
$45<br />
Mainland China<br />
$11,138<br />
$531<br />
$321<br />
$45<br />
Mainland China<br />
Taiwan<br />
$12,134<br />
$579<br />
$342<br />
$51<br />
PURCHASING MANAGER’S INDEX<br />
Taiwan<br />
$13,608<br />
Hong Kong<br />
Hong Kong<br />
$14,200<br />
Macau<br />
$14,569<br />
$589 $605 $613<br />
$363 $362 $363<br />
$55 $50<br />
$27<br />
2015 2016 2017 2018 2019 2020Q4<br />
Jul19<br />
Jun19<br />
Sep20<br />
Aug20<br />
Jul20<br />
Jun20<br />
May20<br />
Apr20<br />
Mar20<br />
Feb20<br />
Jan20<br />
Dec19<br />
Nov19<br />
Oct19<br />
Sep19<br />
Aug19<br />
Nov20<br />
Oct20<br />
Mar21<br />
Feb21<br />
Jan21<br />
Dec20<br />
Expansion Contraction<br />
Business Jet<br />
Turbine Helicopter<br />
Mainland China Taiwan Hong Kong Macau<br />
Turboprop<br />
313<br />
344<br />
338<br />
332<br />
342<br />
495<br />
581<br />
679<br />
718<br />
773<br />
133<br />
157<br />
164<br />
184<br />
191<br />
129<br />
135<br />
135<br />
122<br />
122<br />
10<br />
5 5<br />
27 27<br />
29<br />
4 4<br />
24 25<br />
29<br />
27<br />
5<br />
25 24<br />
4<br />
21<br />
3<br />
11<br />
23<br />
10 10 10<br />
19<br />
18<br />
2<br />
9<br />
1<br />
15 15<br />
2016 2017 2018 2019 2020<br />
4 | ASIAN SKY QUARTERLY — FIRST QUARTER 2021<br />
2016 2017 2018 2019 2020<br />
2016 2017 2018 2019 2020<br />
Data Source : The business jet and helicopter fleet: <strong>Asian</strong> <strong>Sky</strong> Group’s Business Jet Fleet Report & Helicopter Fleet Report, Turboprop data provided by AMSTAT.<br />
The current fleet data is preliminary, all fleet size data will be finalized in upcoming Helicopter / Business Jet Fleet Report.
ECONOMICS<br />
AUSTRALASIA | AUSTRALIA, NEW ZEALAND<br />
Australia<br />
GDP GROWTH (BILLION USD)<br />
Although Australia’s fiscal reporting<br />
period runs slightly different to other<br />
countries, in its latest full year figures<br />
saw the economy contract by 1.1%.<br />
Australia’s economy was originally<br />
forecast to expand by 3.2% in 2021,<br />
however the IMF has since revised its<br />
forecast upwards to 4.5%.<br />
Australia<br />
$1,352<br />
$177<br />
New Zealand<br />
$1,210 $1,331<br />
$188 $203<br />
Papua New Guinea<br />
$1,432 $1,439 $1,484<br />
$205 $206<br />
$204<br />
New Zealand<br />
New Zealand’s economy declined by<br />
2.9% in 2020, following a decline of 11%<br />
in Q2. This was offset by a rebound of<br />
13.9% in Q3, although Q4 saw another<br />
decline.<br />
$22<br />
2015 2016 2017 2018 2019 2020Q4<br />
PURCHASING MANAGER’S INDEX<br />
Australia<br />
$21<br />
New Zealand<br />
$22 $23 $25<br />
$24<br />
70.0%<br />
65.0%<br />
*Data Source : Trading Economics<br />
60.0%<br />
55.0%<br />
50.0%<br />
45.0%<br />
40.0%<br />
35.0%<br />
Expansion Contraction<br />
A reading above 50 indicates an expansion of the<br />
manufacturing sector compared to the previous<br />
month; below 50 represents a contraction; while 50<br />
indicates no change.<br />
30.0%<br />
25.0%<br />
20.0%<br />
Jun19<br />
Jul19<br />
Aug19<br />
Sep19<br />
Oct19<br />
Nov19<br />
Dec19<br />
Jan20<br />
Feb20<br />
Mar20<br />
Apr20<br />
May20<br />
Jun20<br />
Jul20<br />
Aug20<br />
Sep20<br />
Oct20<br />
Nov20<br />
Dec20<br />
Jan21<br />
Feb21<br />
Mar21<br />
FLEET SIZE GROWTH<br />
Business Jet<br />
Turbine Helicopter<br />
Australia New Zealand Papua New Guinea<br />
Turboprop<br />
181<br />
211<br />
186 185<br />
199<br />
808<br />
832<br />
853<br />
844<br />
865<br />
410<br />
428<br />
433<br />
432<br />
431<br />
15<br />
16<br />
19<br />
19<br />
22<br />
462<br />
478<br />
511<br />
534<br />
541<br />
49<br />
51<br />
54<br />
56<br />
58<br />
4<br />
4<br />
4<br />
3<br />
3<br />
107<br />
104<br />
116<br />
103<br />
91<br />
23<br />
22<br />
23<br />
28<br />
29<br />
2016 2017 2018 2019 2020 2016 2017 2018 2019 2020 2016 2017 2018 2019 2020<br />
Data Source : The business jet and helicopter fleet: <strong>Asian</strong> <strong>Sky</strong> Group’s Business Jet Fleet Report & Helicopter Fleet Report, Turboprop data provided by AMSTAT.<br />
The current fleet data is preliminary, all fleet size data will be finalized in upcoming Helicopter / Business Jet Fleet Report.<br />
FIRST QUARTER 2021 — ASIAN SKY QUARTERLY | 5
ECONOMICS<br />
SOUTHEAST ASIA | THAILAND, MALAYSIA & SINGAPORE<br />
Thailand<br />
Thailand’s GDP dropped by 6.1% across 2020, the steepest<br />
decline since the <strong>Asian</strong> financial crisis. This was<br />
largely due to Thailand’s borders being shut, with the<br />
tourism sector particularly badly hit — a sector that has<br />
traditionally contributed to approximately 17% of the<br />
country’s annual GDP.<br />
Malaysia<br />
A decline of 5.6% in Malaysia’s economy during 2020<br />
was steeper than the country’s original estimate of<br />
4.5%. That was largely due to an increase in COVID-19<br />
cases towards the back end of the year, which has<br />
continued into 2021.<br />
Singapore<br />
Singapore’s economy saw a contraction of 5.6% in 2020,<br />
although the rate of decline slowed in the second half<br />
of the year. The city state’s own forecast for the year<br />
was a contraction of between 6 – 6.5%. The economy<br />
was bolstered during the year by increased output in the<br />
manufacturing sector, which expanded by 7.1% across<br />
the full year.<br />
GDP GROWTH (BILLION USD)<br />
Thailand<br />
Malaysia<br />
Singapore<br />
$474 $475<br />
$481<br />
$455<br />
$412<br />
$395<br />
$380<br />
$364 $366<br />
$338<br />
$354<br />
$356 $355<br />
$318<br />
$308<br />
$314<br />
$296 $297<br />
2015 2016 2017 2018 2019 2020Q4<br />
PURCHASING MANAGER’S INDEX<br />
Thailand Malaysia Singapore<br />
60.0%<br />
55.0%<br />
50.0%<br />
45.0%<br />
40.0%<br />
Expansion Contraction<br />
35.0%<br />
30.0%<br />
25.0%<br />
*Data Source : Trading Economics<br />
*A reading above 50 indicates an expansion of the manufacturing sector<br />
compared to the previous month; below 50 represents a contraction;<br />
while 50 indicates no change.<br />
20.0%<br />
Jun19<br />
Jul19<br />
Aug19<br />
Sep19<br />
Oct19<br />
Nov19<br />
Dec19<br />
Jan20<br />
Feb20<br />
Mar20<br />
Apr20<br />
May20<br />
Jun20<br />
Jul20<br />
Aug20<br />
Sep20<br />
Oct20<br />
Nov20<br />
Dec20<br />
Jan21<br />
Feb21<br />
Mar21<br />
FLEET SIZE GROWTH<br />
Business Jet<br />
Turbine Helicopter<br />
Malaysia Singapoire Thailand<br />
Turboprop<br />
60<br />
64<br />
63<br />
61<br />
154<br />
157<br />
161<br />
40<br />
42<br />
44<br />
54<br />
56<br />
59<br />
57<br />
57<br />
139 136<br />
33<br />
48<br />
111 111 110<br />
40<br />
106<br />
38<br />
102<br />
37<br />
35<br />
33<br />
34<br />
28<br />
9<br />
25<br />
19<br />
8<br />
25<br />
18<br />
9<br />
2016 2017 2018 2019 2020 2016 2017 2018 2019 2020 2016 2017 2018 2019 2020<br />
* Data Source : ASG's Annual Business Jet Fleet Report and Helicopter Fleet Report. Turboprop data provided by AMSTAT.<br />
4<br />
6<br />
6<br />
6<br />
0<br />
6<br />
5<br />
6 | ASIAN SKY QUARTERLY — FIRST QUARTER 2021
ECONOMICS<br />
SOUTHEAST ASIA | INDONESIA & PHILIPPINES<br />
Indonesia<br />
GDP GROWTH (BILLION USD)<br />
Indonesia’s economy began to bounce back in the<br />
second half of 2020 and ended the full year by<br />
contracting by 2.1%. The bounce back was driven<br />
by private consumption, as well as by domestic<br />
investment. The World Bank estimates that<br />
Indonesia’s economy will grow by 4.4% in 2021.<br />
Indonesia<br />
$862<br />
Philippines<br />
$1,016<br />
$932<br />
$1,042<br />
$1,024<br />
$1,020<br />
Philippines<br />
The economy in the Philippines saw its worst decline<br />
since 1947 — the year it began keeping records.<br />
Its 9.5% decline was driven by lower household<br />
consumption due to rising unemployment levels.<br />
Its economy is expected to rebound in 2021, but not<br />
reach pre-pandemic levels until mid-2022.<br />
$305 $314 $331 $338 $357<br />
$292<br />
2015 2016 2017 2018 2019 2020Q4<br />
PURCHASING MANAGER’S INDEX<br />
Indonesia<br />
Philippines<br />
*Data Source : Trading Economics<br />
*A reading above 50 indicates an expansion of the manufacturing<br />
sector compared to the previous month; below 50 represents a<br />
contraction; while 50 indicates no change.<br />
60.0%<br />
55.0%<br />
50.0%<br />
45.0%<br />
40.0%<br />
35.0%<br />
30.0%<br />
25.0%<br />
20.0%<br />
Expansion Contraction<br />
Mar21<br />
Feb21<br />
Jan21<br />
Dec20<br />
Nov20<br />
Oct20<br />
Sep20<br />
Aug20<br />
Jul20<br />
Jun20<br />
May20<br />
Apr20<br />
Mar20<br />
Feb20<br />
Jan20<br />
Dec19<br />
Nov19<br />
Oct19<br />
Sep19<br />
Aug19<br />
Jul19<br />
Jun19<br />
FLEET SIZE GROWTH<br />
Business Jet<br />
Turbine Helicopter<br />
Turboprop<br />
Indonesia<br />
Philippines<br />
51<br />
51<br />
53<br />
51<br />
203<br />
208<br />
207<br />
219<br />
221<br />
104<br />
117<br />
116<br />
119<br />
121<br />
50<br />
48<br />
48<br />
49<br />
47<br />
46<br />
62<br />
59<br />
61<br />
162<br />
163<br />
57<br />
52<br />
156<br />
155<br />
156<br />
2016 2017 2018 2019 2020 2016 2017 2018 2019 2020 2016 2017 2018 2019 2020<br />
* Data Source : ASG's Annual Business Jet Fleet Report and Helicopter Fleet Report. Turboprop data provided by AMSTAT.<br />
FIRST QUARTER 2021 — ASIAN SKY QUARTERLY | 7
ECONOMICS<br />
EAST ASIA & CENTRAL ASIA | JAPAN, SOUTH KOREA & INDIA<br />
Japan<br />
GDP GROWTH (BILLION USD)<br />
Japan’s economy declined by 4.8% in 2020 — the<br />
first time since 2009 that the country’s economy<br />
contracted. However, the economy had rebounded<br />
by 3% in Q4, driven by an increase in exports,<br />
private consumption, and private investment. The<br />
country expects that its economy will grow by 4%<br />
in 2021.<br />
Japan<br />
$4,389<br />
$4,927<br />
South Korea<br />
$4,860<br />
India<br />
$4,971<br />
$5,018<br />
$4,734<br />
$3,128<br />
South Korea<br />
South Korea’s economy declined by 1% in 2020<br />
— the first time that it had contracted in 22 years.<br />
The contraction was driven by a steep decline in<br />
exports, with April alone seeing a 24.3% drop.<br />
India<br />
Following a plunge in GDP of 23.9% in Q1 2020, India’s<br />
economy contracted by 7.1% for the full year.<br />
A V shaped recovery began during the third quarter,<br />
and is expected to continue into 2021, with the IMF<br />
forecasting full year growth of 12.5%.<br />
$2,899<br />
$2,769<br />
$2,597<br />
$2,274<br />
$2,095<br />
$1,378 $1,415<br />
$1,531 $1,619 $1,640 $1,660<br />
2015 2016 2017 2018 2019 2020Q4<br />
PURCHASING MANAGER’S INDEX<br />
South Korea<br />
Japan<br />
India<br />
65.0%<br />
60.0%<br />
55.0%<br />
50.0%<br />
45.0%<br />
40.0%<br />
Expansion Contraction<br />
<br />
<br />
<br />
<br />
<br />
35.0%<br />
<br />
*Data Source : Trading Economics<br />
30.0%<br />
<br />
*A reading above 50 indicates an expansion of the manufacturing<br />
sector compared to the previous month; below 50 represents a<br />
contraction; while 50 indicates no change.<br />
25.0%<br />
20.0%<br />
<br />
FLEET SIZE GROWTH<br />
Jun19<br />
Jul19<br />
Aug19<br />
Sep19<br />
Oct19<br />
Nov19<br />
Dec19<br />
Jan20<br />
Feb20<br />
Mar20<br />
Apr20<br />
May20<br />
Jun20<br />
Jul20<br />
Aug20<br />
Sep20<br />
Oct20<br />
Nov20<br />
Dec20<br />
Jan21<br />
Feb21<br />
Mar21<br />
Business Jet<br />
Turbine Helicopter<br />
Japan India South Korea<br />
Turboprop<br />
138<br />
140<br />
140<br />
138 137<br />
646<br />
647<br />
646<br />
664<br />
673<br />
134<br />
155<br />
155<br />
97<br />
94<br />
92<br />
78<br />
73<br />
77<br />
76<br />
54 54 55<br />
63 61<br />
291<br />
286<br />
287<br />
285<br />
288<br />
232 231<br />
19<br />
227 229<br />
16 16<br />
17 17<br />
21 21<br />
19<br />
21<br />
17<br />
222<br />
2016 2017 2018 2019 2020 2016 2017 2018 2019 2020 2016 2017 2018 2019 2020<br />
* Data Source : ASG's Annual Business Jet Fleet Report and Helicopter Fleet Report. Turboprop data provided by AMSTAT.<br />
8 | ASIAN SKY QUARTERLY — FIRST QUARTER 2021
SINO JET<br />
World’s Leading Private Jet Company<br />
Staying true to our responsibility as a market leader,<br />
Sino Jet has launched SKY BUTLER ELITE TRAINING PROGRAM<br />
to promote the development of business aviation<br />
SKY BUTLER ELITE TRAINING PROGRAM<br />
5P will be gained by the training courses<br />
• Profound knowledge and industry insight<br />
• Premium service skills<br />
• Paths for occupational development<br />
• Professional resources in the field of business jet<br />
• Positive effect in life and career<br />
To Begin and Follow Your Flying Dream with Sino Jet<br />
Open to all aviation professionals and high-end<br />
service practitioners<br />
To learn more, please email academy@sinojet.org.cn<br />
Or add wechat QR code<br />
Sincere / We actively engage guests<br />
and partners with a sincere smile, and always<br />
strive to clearly address all concerns.<br />
Involved / We understand the market<br />
very well and take accountability for the<br />
business jet industry.<br />
Niche / We will walk the extra mile and<br />
provide tailored services to all guests and<br />
industry partners.<br />
Outstanding / Through the highest<br />
safety standards and excellence in service<br />
quality, we have become the industry<br />
benchmark for excellence and the fastest<br />
growing organization.<br />
Jovial / We are a committed, dynamic<br />
and enthusiastic team.<br />
Engaged / We listen to your needs<br />
and always endeavor to build.<br />
Trustworthy / Striving our best to<br />
be a company that clients, employees and<br />
partners trust.<br />
www.sinojet.org | (86-10) 8416 2588 – Beijing | (852) 2588 7000 – Hong Kong<br />
FIRST QUARTER 2021 — ASIAN SKY QUARTERLY | 9<br />
BEIJING | HONG KONG | SHANGHAI | HANGZHOU | SHENZHEN | GUANGZHOU | CHENGDU | XIAMEN | ZHUHAI | SINGAPORE
MOOD& INTENTIONS<br />
INTENTIONS ASIA-PACIFIC SURVEY Q1 2021<br />
RESPONDENT BREAKDOWN<br />
RESPONDENTS LOCATIONS<br />
Rest of the World (6%)<br />
Oceania (9%)<br />
Greater<br />
China (21 %)<br />
Central Asia & Middle East (34%)<br />
SE & NE Asia (30%)<br />
Results Summary in Q1 2021<br />
1. Optimism continued to increase in Q1 2021.<br />
2. COVID-19 is still having a serious effect on the<br />
industry.<br />
3. Aircraft utilization continued to show signs of<br />
stabilization, with 35% of respondents reporting<br />
increased fleet utilization in 21Q1 vs 20Q1.<br />
4. Aircraft purchase intention level decreased.<br />
TOP 10 RESPONDENT’S LOCATIONS<br />
Indonesia (4%)<br />
Thailand (5%)<br />
Pakistan (6%)<br />
United Arab Emirates (7%)<br />
Malaysia (7%)<br />
India (17%)<br />
China (14%)<br />
In Q1 2021 more than 390 business aviation professionals<br />
responded to ASG’s latest quarterly survey about the<br />
mood and intentions in the industry.<br />
The regions with the most respondents include:<br />
1. Central Asia & Middle East (34%, incl. India, Pakistan,<br />
UAE etc.) 2. Southeast and Northeast Asia (30%) 3.<br />
Greater China (21%) 4. Oceania (9%)<br />
Australia (8%)<br />
Singapore (8%)<br />
Hong Kong (13%)<br />
Philippines (11%)<br />
The majority (59%) of the respondents are related to<br />
business jets operations.<br />
RESPONDENT AIRCRAFT TYPE<br />
Turboprop (21%)<br />
In total, 63% of the respondents from this quarter’s survey<br />
are from aircraft service providers (FBO, MRO, etc.)<br />
and aircraft operators. This was followed by smaller percentages<br />
of aircraft brokers (11%), and aircraft end users<br />
(4%). The remainder of the respondents are from other<br />
associated areas.<br />
Civil Helicopter (20%)<br />
Business Jet (59%)<br />
COVID-19 Pandemic Asia-Pacific<br />
RESPONDENT CATEGORY<br />
Owner /<br />
Charter User (4%)<br />
Broker (11%)<br />
Others** (22%)<br />
Aircraft Service<br />
Providers* (33%)<br />
The first quarter of 2021 saw some economic recovery<br />
across Asia-Pacific, with an increase in optimism seen<br />
across all regions.<br />
The Chinese economic recovery that began in the second<br />
quarter of 2020 helped stabilize the pessimistic<br />
mood in the region. Overall, Q1 2021 saw the highest<br />
level of optimism across all regions since the beginning<br />
of the pandemic.<br />
Aircraft Operator<br />
/Management Company (30%)<br />
* Aircraft Service Providers include: financial services, training,<br />
FBO, ground handlers, Service, MRO, parts, etc.<br />
** Others include law firms, research facilities and government officials<br />
10 | ASIAN SKY QUARTERLY — FIRST QUARTER 2021
MOOD & INTENTIONS: ASIA-PACIFIC REGION SURVEY 2021 Q1<br />
The highlights of this quarter’s COVID-19 responses<br />
included:<br />
• The number of respondents saying their business<br />
had been “Seriously Affected” continued to decrease.<br />
• Domestic business continues to recover and perform<br />
better than the overseas segment.<br />
However, when asked about the market bouncing<br />
back, a higher percentage of respondents (44%) in<br />
this quarter believe that market demand will not<br />
bounce back in the first half of 2021.<br />
COVID-19 IMPACT IN ASIA-PACIFIC<br />
Has the COVID-19 outbreak affected you or your organization’s<br />
business so far?<br />
2020Q1<br />
2020Q2<br />
2020Q3<br />
2020Q4<br />
<strong>2021Q1</strong><br />
68%<br />
63%<br />
68%<br />
72% 71%<br />
25% 24%<br />
As in the previous quarter, we believe this could be<br />
viewed as companies readjusting their business<br />
goals, and having lower expectations in the current<br />
economic cycle.<br />
Aircraft Utilization<br />
27% 28%<br />
25%<br />
6%<br />
4%<br />
5%<br />
3% 2%<br />
3%<br />
1% 2%<br />
1% 1%<br />
Hard to tell Not affected Seriously affected Somewhat affected<br />
In Q1 2021, data from German business aviation<br />
consultancy WingX Advance, shows signs that flights<br />
have begun to return to 2019 levels, with a 66% yearon-year<br />
increase in March.<br />
Do you foresee market demand bouncing back in the 2nd<br />
half-year of 2020/1st half year of 2021?<br />
Hard to tell at the moment<br />
No<br />
Yes<br />
This was in driven by an increase in domestic flying<br />
within mainland China & India, which In March alone<br />
saw huge year-on-year increases in flight activities<br />
equivalent to a rate of 225% and 102%, respectively.<br />
40%<br />
38%<br />
38%<br />
36%<br />
27%<br />
Respondents across all regions said that their<br />
flight activity had increased, yet there remains a<br />
high proportion that say that their flight activities<br />
have decreased.<br />
Purchase Intentions<br />
The first quarter of 2021 also saw a slight decrease<br />
in the purchase intentions of respondents, with 44.4%<br />
saying that they would now be willing to purchase an<br />
aircraft – less than 1% change when compared to the<br />
previous quarter.<br />
24%<br />
36%<br />
2020Q1<br />
27%<br />
35%<br />
2020Q2<br />
29%<br />
34%<br />
2020Q3<br />
Rank the following factors that you think are critical to the future<br />
of business aviation / general aviation (the lower the better):<br />
Value for Price Paid<br />
2.5<br />
32%<br />
33%<br />
2020Q4<br />
44%<br />
30%<br />
<strong>2021Q1</strong><br />
After the pre-owned market had a dynamic<br />
December which saw record levels of transactions,<br />
we saw an increased portion of respondents<br />
(mainly brokers) believing we are now seeing a<br />
balanced market in general, where supply and<br />
demand are at similar levels.<br />
Privacy<br />
Maintenance Support<br />
3.5<br />
4.1<br />
3.0<br />
3.0<br />
Customer Service<br />
2.7<br />
More Important<br />
Flexibility / Punctuality<br />
Cabin Sanitation<br />
FIRST QUARTER 2021 — ASIAN SKY QUARTERLY | 11
MOOD & INTENTIONS: ASIA-PACIFIC REGION SURVEY 2021 Q1<br />
In terms of your current level of business recovery, how does your domestic business volume compare to<br />
your international business volume:<br />
International business recovery<br />
is better than domestic<br />
100%<br />
90%<br />
80%<br />
70%<br />
8%<br />
1%<br />
10%<br />
0%<br />
21%<br />
27%<br />
2%<br />
12%<br />
3%<br />
18%<br />
My business have not been affected<br />
by COVID-19 aso far<br />
60%<br />
49%<br />
36%<br />
20%<br />
Hard to tell at the moment<br />
50%<br />
40%<br />
48%<br />
Domestic business recovery is<br />
better than international<br />
30%<br />
27%<br />
Both have not started to recover<br />
20%<br />
10%<br />
32%<br />
43%<br />
24%<br />
19%<br />
0%<br />
Aircraft Operator /<br />
Management Company<br />
Aircraft Owner /<br />
Charter User<br />
Aircraft Sales /<br />
Charter Broker<br />
Other Related<br />
(FBO, MRO, etc)<br />
ECONOMIC STATUS<br />
Optimism Levels Since 2018Q1 - Regional Differences*<br />
Greater China<br />
Central Asia & Middle East SE & NE Asia Oceania Overall<br />
100%<br />
93%<br />
93%<br />
95%<br />
90%<br />
80%<br />
70%<br />
60%<br />
50%<br />
40%<br />
89%<br />
86%<br />
80%<br />
88%<br />
84%<br />
79%<br />
74%<br />
86%<br />
85%<br />
81%<br />
83%<br />
68%<br />
64%<br />
61% 61%<br />
48%<br />
42%<br />
84%<br />
81%<br />
75%<br />
71%<br />
66%<br />
60%<br />
56% 58%<br />
45%<br />
89%<br />
73%<br />
62%<br />
55%<br />
83%<br />
70%<br />
60%<br />
59%<br />
67%<br />
58%<br />
50%<br />
53%<br />
52%<br />
44%<br />
41%<br />
37%<br />
75%<br />
74%<br />
71%<br />
70%<br />
62%<br />
77%<br />
75%<br />
70%<br />
68%<br />
52%<br />
84%<br />
83%<br />
73%<br />
30%<br />
31%<br />
29%<br />
30%<br />
20%<br />
20%<br />
2018Q1<br />
2018Q2<br />
2018Q3<br />
2018Q4<br />
2019Q1<br />
2019Q2<br />
2019Q3<br />
2019Q4<br />
2020Q1<br />
2020Q2<br />
2020Q3<br />
2020Q4<br />
<strong>2021Q1</strong><br />
* Since 2021 Q1, the responses have been reorganized based on submitted time.<br />
12 | ASIAN SKY QUARTERLY — FIRST QUARTER 2021
MOOD & INTENTIONS: ASIA-PACIFIC REGION SURVEY 2021 Q1<br />
What is the current economic status? (<strong>Quarterly</strong> comparsion)<br />
100%<br />
Past Low Point<br />
42%<br />
36%<br />
30%<br />
31%<br />
19%<br />
23%<br />
30% 26%<br />
35%<br />
27%<br />
30%<br />
52%<br />
54%<br />
31%<br />
29%<br />
At Low Point<br />
Optimistic<br />
(Will get better)<br />
26%<br />
29%<br />
36%<br />
29%<br />
32%<br />
24%<br />
45%<br />
40%<br />
54%<br />
38%<br />
30%<br />
Pessimistic 11%<br />
(Will get worse)<br />
0%<br />
2018Q1<br />
16%<br />
2018Q2<br />
32%<br />
2018Q3<br />
36%<br />
2018Q4<br />
34%<br />
2019Q1<br />
40%<br />
2019Q2<br />
38%<br />
41%<br />
50%<br />
48%<br />
29%<br />
2019Q3 2019Q4 2020Q1 2020Q2 2020Q3<br />
32%<br />
Not Reached Low Point<br />
2020Q4<br />
16%<br />
<strong>2021Q1</strong><br />
PURCHASE INTENTION<br />
Where are we in the current pre-owned market?<br />
Buyer’s Market<br />
Balanced Market<br />
40%<br />
29%<br />
47%<br />
28%<br />
43%<br />
38%<br />
38%<br />
41%<br />
38%<br />
58%<br />
50%<br />
28%<br />
55%<br />
66%<br />
54%<br />
62%<br />
62%<br />
48%<br />
30%<br />
Seller’s Market<br />
I’m not sure<br />
21%<br />
10%<br />
17%<br />
8%<br />
14%<br />
5%<br />
26%<br />
10%<br />
16%<br />
5%<br />
20%<br />
15%<br />
8%<br />
17%<br />
6%<br />
21%<br />
15%<br />
9%<br />
13%<br />
12%<br />
8%<br />
22%<br />
13%<br />
11%<br />
18%<br />
13%<br />
8%<br />
17%<br />
10%<br />
15%<br />
8%<br />
2018<br />
Q1<br />
2018<br />
Q2<br />
2018<br />
Q3<br />
2018<br />
Q4<br />
2019<br />
Q1<br />
2019<br />
Q2<br />
2019<br />
Q3<br />
2019<br />
Q4<br />
2020<br />
Q1<br />
2020<br />
Q2<br />
2020<br />
Q3<br />
2020<br />
Q4<br />
2021<br />
Q1<br />
Purchase Intention 2018Q1 - <strong>2021Q1</strong><br />
Yes, a new aircraft<br />
Yes, a pre-owned aircraft<br />
No/I’m not sure<br />
41.2%<br />
30.7%<br />
28.1%<br />
39.6%<br />
29.6%<br />
30.8%<br />
37.4%<br />
32.0%<br />
30.6%<br />
40.7%<br />
30.0%<br />
29.2%<br />
43.3%<br />
28.5%<br />
28.1%<br />
45.7%<br />
27.4%<br />
26.9%<br />
52.9%<br />
26.7%<br />
20.4%<br />
48.2% 48.5%<br />
28.0%<br />
26.4%<br />
23.8% 25.1%<br />
58.8% 57.8%<br />
21.9% 22.0%<br />
19.3%<br />
20.2%<br />
54.9%<br />
23.2%<br />
21.9%<br />
55.6%<br />
22.4%<br />
22.0%<br />
2018<br />
Q1<br />
2018<br />
Q2<br />
2018<br />
Q3<br />
2018<br />
Q4<br />
2019<br />
Q1<br />
2019<br />
Q2<br />
2019<br />
Q3<br />
2019<br />
Q4<br />
2020<br />
Q1<br />
2020<br />
Q2<br />
2020<br />
Q3<br />
2020<br />
Q4<br />
2021<br />
Q1<br />
FIRST QUARTER 2021 — ASIAN SKY QUARTERLY | 13
MOOD & INTENTIONS: ASIA-PACIFIC REGION SURVEY 2021 Q1<br />
Regional Differences (Fixed Wing)<br />
Corporate Airliner Large Jet Mid-size Jet Light Jet Turboprop / Piston Fixed Wing<br />
Southeast &<br />
Northeast Asia<br />
17% 36%<br />
28%<br />
14% 6%<br />
Oceania<br />
18% 18%<br />
9%<br />
36%<br />
18%<br />
Greater China<br />
4% 58%<br />
27%<br />
8% 4%<br />
Central Asia &<br />
Middle East<br />
25%<br />
25% 25% 7%<br />
18%<br />
Purchase Intention - Fixed Wing<br />
Purchase Intention - Helicopters<br />
Corporate Airliner<br />
(Such as ACJ, BBJ)<br />
Twin Turbine<br />
(Such as Sikorsky S-76C++)<br />
Most Preferred<br />
Turboprop/Piston<br />
Fixed Wing<br />
(Such as King Air Series)<br />
Large Jet<br />
(Such as G650,<br />
Falcon 8X)<br />
Most Preferred<br />
Small Jet<br />
(Such as Citation Series,<br />
Hawker Series)<br />
Midsize Jet<br />
(Such as G200 & CL650)<br />
Piston Helicopter<br />
(Such as Robinson R22)<br />
Single Turbine Helicopter<br />
(Such as Bell 206)<br />
Purchase Decisions - Influencing Factors*<br />
Government / Public Opinion<br />
Greater China<br />
Oceania<br />
Inconvenient to Use<br />
No Interesting Aircraft<br />
Central Asia<br />
SE & NE Asia<br />
Most Limited<br />
No Need<br />
Price<br />
*Outer means more limited<br />
14 | ASIAN SKY QUARTERLY — FIRST QUARTER 2021
FLEET UTILIZATION<br />
100%<br />
50%<br />
Summary : Aircraft Utilization Changes In Past 2 Years<br />
Up by 20% and more (>20%)<br />
Up but less than 20% (0 - 20%)<br />
The same (0%)<br />
MOOD & INTENTIONS: ASIA-PACIFIC REGION SURVEY 2021 Q1<br />
Down but less than 20% (-20 - 0%)<br />
19%<br />
16%<br />
8%<br />
18%<br />
39%<br />
INCREASED<br />
SAME<br />
DECREASED<br />
0%<br />
Down by 20% or more (
COMMENTARY: CLYDE & CO<br />
DEFAULTS, RECOVERIES &<br />
OPPORTUNITIES IN BUSINESS AVIATION<br />
The unprecedented economic crisis caused by the coronavirus pandemic has led to a dramatic increase in global<br />
corporate and individual defaults and debts. Aircraft repossessions, lawsuits for breach of contract, petitions for<br />
winding up companies and bankrupting individuals have all risen.<br />
For some organisations it has also revealed underlying weaknesses relating to how they conduct appropriate due diligence<br />
of borrowers both before and after financing/loans have been agreed, their approach to legal and contractual risk management<br />
and managing pre-existing, pre COVID-19 debts, in addition to new debts.<br />
Many of the pandemic’s anticipated consequences have arisen. Travel restrictions reduced flight operations. This in turn reduced<br />
sentiment among many market participants for new acquisitions and new loans or financings, whilst at the same time<br />
causing other existing participants to seek additional liquidity and new entrants to seek jet financing for the first time. In many<br />
countries, the ability to complete sale and purchase transactions have been impacted. Buyers have been unable to visit and<br />
inspect aircraft, whether at an aircraft manufacturer’s showroom or a maintenance facility. It has also been difficult to source<br />
parts. Some aircraft registries have been working at reduced capacity, impacting the processing of documents. In addition,<br />
many aircraft owners have been focussing on challenges to their businesses, some on survival itself and therefore have sought<br />
to release equity in aircraft.<br />
In this article we consider some areas where owner/borrower defaults may affect their banks/financiers and aircraft managers/operators.<br />
We discuss certain recovery considerations and restrictions, and we identify some of the process risks facing<br />
new entrants and borrowers in the present pandemic circumstances.<br />
16 | ASIAN SKY QUARTERLY — FIRST QUARTER 2021
COMMENTARY: CLYDE & CO<br />
Existing Transactions<br />
in Pressure Circumstances<br />
Testing Relationships and Contracts<br />
The pandemic has tested the relationships of banks/financiers<br />
and aircraft managers/operators in numerous ways, both as between<br />
themselves and with their owner/borrower customers. It is<br />
not uncommon for defaults to first occur under a management<br />
agreement between an operator and the aircraft owner, before<br />
the owner/borrower defaults under its financing arrangements.<br />
It is also not uncommon for tell-tale problems to surface many<br />
months or even years before any action is taken. If the aircraft is<br />
financed, then it is likely that a manager/operator will be unable<br />
to exercise a lien over the aircraft in competition to the financier.<br />
If a default then occurs under the financing, a bank/financier is<br />
likely to have to act quickly and repossess and sell the aircraft<br />
to protect its interests. It is at this point that relationships and<br />
contracts really matter. Banks/financiers need the help of managers/operators<br />
to locate and safeguard the aircraft, whether to<br />
exercise self-help remedies or to enforce court orders. Managers<br />
and operators, who may well be owed substantial management<br />
fees and costs by then, will not want to be required to incur further<br />
costs without pay.<br />
(b) if they are costs incurred by a party at the direction of another<br />
party and whether that (or another) party is responsible for<br />
those costs; and<br />
(c) what time period the costs apply to (for example, before or<br />
after the relevant default), and whether any indemnities or other<br />
costs provisions cover those costs over that time period;<br />
(iv) if a party is permitted or restricted from taking legal proceedings<br />
against any other party; and<br />
(v) if a party has any right to terminate or suspend any of the transaction<br />
contracts or arrangements (including under their own contracts<br />
and those of other parties) and the ability of other parties<br />
to do so.<br />
When reviewed in the context of a particular default and the practical<br />
circumstances existing at that time, some parties may find<br />
the legal requirements of the documentation are at odds with their<br />
preferred way to manage or resolve the situation. They will need to<br />
proceed carefully to ensure they maximise their own best interests,<br />
whilst protecting their commercial relationships and complying<br />
with their own contractual obligations.<br />
Upon the occurrence of a default situation, most banks/financiers<br />
and managers/operators will typically review the legal requirements<br />
of the transaction documentation governing their<br />
relationships. Common contractual clauses which are typically<br />
relevant in these circumstances include provisions governing:<br />
(i) the extent to which the parties are required or permitted to<br />
provide and exchange information concerning other parties (particularly<br />
the owner/borrower), the aircraft and the circumstances<br />
of the default;<br />
(ii) whether, and to what extent, a party must either<br />
(a) coordinate their proposed actions with another party, or<br />
(b) follow the instructions of another party to take particular<br />
actions;<br />
(iii) whether any fees, costs or expenses (collectively referred to<br />
here simply as ‘costs’) of a party are recoverable in circumstances<br />
where the owner/borrower does not pay. There are usually<br />
multiple aspects to consider and analyse regarding these provisions,<br />
including:<br />
(a) the type of costs incurred (for example, if the costs are<br />
incurred by a manager/operator, whether they are aircraft-related<br />
costs or service-related costs, and whether different types of<br />
costs are treated differently under the documentation);<br />
Defaults and Recovery Actions<br />
Tensions commonly escalate due to default situations being handled<br />
by some parties differently in practice from how the transaction<br />
documentation anticipated it would be handled. This divergence<br />
is not surprising, bearing in mind that the documentation<br />
was probably agreed in a different practical context – i.e., at a time<br />
when there were no problems and when banks/financiers and managers/operators<br />
may have had an idealistic view that problems<br />
would be handled in a fully transparent and cooperative manner as<br />
between themselves. It is not uncommon for parties to have loosely<br />
assumed at the time of entering a transaction that, if problems<br />
did arise, then there would be<br />
(i) a free flow of ‘perfect information’ between the parties,<br />
FIRST QUARTER 2021 — ASIAN SKY QUARTERLY | 17
COMMENTARY: CLYDE & CO<br />
(ii) each party would in fact monitor, assess and understand the<br />
implications of that information,<br />
(iii) each party would act appropriately on that information to<br />
resolve the situation in a quick and efficient manner.<br />
However, in practice, there is often a limited flow of information<br />
which is not assessed, or the implications quickly understood<br />
by all parties, and in many cases effective action is not<br />
taken quickly.<br />
To avoid common pressure points getting worse in a default situation,<br />
it is fundamental that parties<br />
(i) review and consider their documentation immediately,<br />
(ii) plan in advance how to best protect and maximise their interests,<br />
(iii) take action quickly to secure the best results. Of course,<br />
steps could also have been taken prior to the commencement of<br />
a relationship to have a contingency plan in place.<br />
No two cases of recovery are exactly alike. There are many considerations<br />
including the age and value of the debt, the duration<br />
of the commercial relationship, the geographical location of the<br />
debtor, any guarantor, the aircraft (where it is ordinarily based<br />
and where it frequently visits) and any other assets, and what legal<br />
rights and remedies the financier, borrower and third parties<br />
may have outside the documentation.<br />
Many common law jurisdictions recognise a financier’s right<br />
to take possession of an aircraft without the need for a Court<br />
order, provided that the relevant rights have arisen and the<br />
requirements in the finance documents for notices are fully<br />
observed. In some jurisdictions self-help remedies constitute<br />
unlawful interference with property and judicial involvement is<br />
required before any steps can be taken. Even where self-help<br />
remedies are lawful, it may be advisable to obtain a judicial<br />
order restraining the aircraft from leaving the jurisdiction to<br />
guard against the risk of later claims of unlawful interference<br />
from the borrower or lessee. A judicial order will also assist in<br />
demonstrating to any third party, such as airport authorities,<br />
an operator or manager, that the financier’s right to seize the<br />
aircraft has arisen. However, even if a financier is able to repossess<br />
an aircraft and sell it, the sale proceeds may be insufficient<br />
to cover a loan.<br />
It is critical to not leave debts to lie under the carpet or to fester<br />
for too long. As we have seen, many of the recoveries today<br />
involve debts that began to arise several years before the commencement<br />
of COVID-19. The longer a debt is left, the more<br />
likely there will be dissipating assets and the emergence of other<br />
creditors with competing interests. In the context of aviation,<br />
those creditors will include national aviation authorities, air traffic<br />
bureaus and airports who often have superior rights. Securing<br />
the release of an aircraft from a statutory lien can be problematic,<br />
particularly if banks/financiers are unwilling to settle the debts<br />
owed by an operator or borrower.<br />
The reality is that many banks/financiers are now in a position<br />
where their best hope of a recovery is to petition for the winding up<br />
or bankruptcy of borrowers or guarantors, who may be companies<br />
or individuals. Increasingly, banks/financiers are having to join in<br />
with other creditors who have already taken such action. It is at<br />
this point that the prospects of a successful recovery are less certain.<br />
Had they taken action much earlier they would have stood a<br />
much better chance of recovering the debts owed.<br />
New Transactions in<br />
Pressure Circumstances<br />
As mentioned above, whilst the pandemic is causing stress within<br />
existing transactions it is also creating opportunities for new<br />
transactions. For example, sale and purchase transactions continue,<br />
and financing transactions are being supported for both existing<br />
industry participants seeking additional liquidity and for new<br />
entrants seeking jet financing for the first time.<br />
There are additional challenges in completing corporate and private<br />
aircraft transactions during the pandemic, many of which are<br />
process-driven challenges relating to physical access to aircraft.<br />
In addition, it is even more important than usual for traditional<br />
execution and process risks to be considered and managed appropriately<br />
during the pandemic to avoid failed transactions or<br />
alienating new entrants from the market. For instance, many new<br />
entrant principals:<br />
(i) may not understand the scope and potential complexities of<br />
what is involved in purchasing or financing aircraft,<br />
18 | ASIAN SKY QUARTERLY — FIRST QUARTER 2021
COMMENTARY: CLYDE & CO<br />
(ii) often have existing (and long term) professional advisors who<br />
also may not be experienced in aircraft transactions; and<br />
(iii) often under-estimate the personnel resources needed to effectively<br />
execute their first aircraft transaction.<br />
Coping with and re-skilling these challenges can be an uphill<br />
battle, particularly in circumstances where one or more parties<br />
are already desperate to complete the transaction due to other<br />
pandemic pressures. Unless a customer has credible and experienced<br />
advisors actively supporting and managing their transaction,<br />
there is a greater risk a transaction may fail.<br />
Many reputable aircraft brokers, banks/financiers and aircraft<br />
managers/operators are very good at dealing with first time aircraft<br />
customers and have adapted their services to pandemic circumstances<br />
(for example, using real-time and recorded video to<br />
replace inspection visits and to offer new entrants professional<br />
support and educational materials). Likewise, many other professional<br />
advisors such as lawyers, tax and technical advisors are<br />
tailoring their services to handle new transactions in the pandemic<br />
circumstances.<br />
Reflection and Opportunity<br />
For many organisations, the pandemic has provided an opportunity<br />
to reflect on the due diligence which they conducted on borrowers<br />
and guarantors before they entered into transactions and how<br />
they monitor transactions on an ongoing basis. The pandemic<br />
is also causing organisations to review the protection sought<br />
contractually and through contingency planning to either prevent<br />
debts arising in the first place or to make it easier to recover them<br />
when the best opportunities arise. The Aviation Practice at Clyde<br />
& Co regularly conducts audits on contracts, advises on contingency<br />
planning and recoveries. As Winston Churchill is credited<br />
with first saying, “Never let a good crisis go to waste.” Have you?<br />
www.clydeco.com<br />
Stuart Miller and Peter Coles are Partners in the APAC Aviation Practice of law firm Clyde & Co.<br />
Peter Coles<br />
Partner, Hong Kong<br />
E: Peter.Coles@clydeco.com<br />
T: +852 2287 2721<br />
Stuart Miller<br />
Partner, Hong Kong<br />
E: Stuart.Miller@clydeco.com<br />
T: +852 2287 2717<br />
Clyde & Co accepts no responsibility for loss occasioned to any person acting or refraining from acting<br />
as a result of material contained in this summary. No part of this summary may be used, reproduced,<br />
stored in a retrieval system or transmitted in any form or by any means, electronic, mechanical, photocopying,<br />
reading or otherwise without the prior permission of Clyde & Co.<br />
© Clyde & Co LLP 2021<br />
FIRST QUARTER 2021 — ASIAN SKY QUARTERLY | 19
INTERVIEW: SINO JET<br />
INTERVIEW: SINO JET<br />
ROSELLE WONG, DIRECTOR OF SERVICE DELIVERY<br />
Ms. Roselle Wong is the Director of Service Delivery at Sino Jet, responsible for<br />
formulating internal training standards, cabin services and management. She is<br />
also the chairperson of the Flight Attendant Committee for the Beijing Business<br />
Aviation Association (BBAA). She was awarded the “Best Individual Award for<br />
Business Aviation Promotion of the year” in the Golden Wing Awards, which is the<br />
most influential award ceremony in China business aviation. Roselle has 15 years’<br />
experience in luxury service management.<br />
Sino Jet had a great 2020, has that momentum<br />
continued into 2021?<br />
According to our past flight activity data (Q1 in 2019 & 2020), we expect<br />
significant growth in 2021. Within the first three months of 2021,<br />
the number of flights increased about 70% over 2020, and were 60%<br />
higher than in 2019. At the same time, flight hours have increased by<br />
20% and 40% when compared to 2020 and 2019, respectively.<br />
As the pandemic has been under control in China, we have seen a<br />
dramatic growth in demand for our business jet services. This proves<br />
Sino Jet’s strength in delivering the highest service standard and efficiency<br />
that is essential to cater to market needs.<br />
During this period, we noticed that customers are becoming more rational<br />
towards the use of business jets. They are no longer viewed as<br />
a luxury toy but an efficient, safe, and secure transportation tool that<br />
acts as a time machine to help achieve greater business success.<br />
What measures has Sino Jet put in place to combat<br />
the spread of COVID-19?<br />
We take three factors in consideration:<br />
• The personal safety of front-line employees, such as flight<br />
crew, cabin crew and engineers.<br />
• The personal safety of the staff back in the office.<br />
• The safety of our customers.<br />
Employees are the company’s most valuable assets and the foundation<br />
of our operations. Sino Jet continuously improves and adjusts<br />
its approach to the ever-changing logistical challenges of the<br />
times, provides pandemic education, and risk management training.<br />
We also offer anti-pandemic materials and conduct real-time health<br />
status management to protect the safety of our colleagues and to<br />
ensure that we have the manpower and personnel support for flight<br />
20 | ASIAN SKY QUARTERLY — FIRST QUARTER 2021
INTERVIEW: SINO JET<br />
operations. We closely manage our passengers travel history, as well<br />
as their upcoming trip requests, to ensure their smooth travel in and<br />
out of various countries, especially with fluctuating policies regarding<br />
COVID-19. With this information we can provide travel suggestions<br />
based on the destination’s risk assessment status and pandemic prevention<br />
policies.<br />
represented the Cabin Services Department during the delivery and<br />
traveled to Canada along with my colleagues from maintenance and<br />
flight operations. The full support of our senior management and<br />
Bombardier allowed the aircraft to successfully enter into service in<br />
the shortest possible time, meeting and exceeding the travel needs<br />
of the client.<br />
Throughout the project, our team showed dedication, flexibility,<br />
To make it clear, safety is our<br />
number one priority. To manage<br />
risks during our operations, we<br />
actively communicate with relevant<br />
authorities, aircraft manufacturers<br />
and safety partners such as MedAire<br />
so that we can develop higher<br />
standards and cohesion within our<br />
departments such as cabin services,<br />
flight operations, and engineering.<br />
and professionalism. We were driven by our mission of providing<br />
safe, secure air travel for our clients. In the face of difficulties<br />
everyone rallied together, injected their individual expertise, and<br />
came up with solutions to satisfy demands. It is very touching to<br />
see our team’s hard work, sacrifices, and dedication to both the<br />
client and to Sinojet.<br />
We hope to grow the fleet steadily and show more customers ‘our competence,<br />
character, and unwavering commitment to the job at hand.<br />
In the past few months, Sino Jet has held several<br />
<strong>Sky</strong> Butler Training Courses. As the company’s<br />
service and training director, can you please share<br />
more information of the course?<br />
The Cabin Services Department has developed a Standard Operating<br />
Procedure to maintain the hygiene of aircraft, with an emphasis<br />
on prevention. Our team will disinfect aircraft prior to departure,<br />
during flight, and after landing. Before operation, the corporate<br />
flight attendant will select reliable catering service providers that<br />
offer contactless delivery. The mindset of prevention is included in<br />
all aspects of our operation.<br />
You were personally part of a team that delivered<br />
a brand-new Bombardier Global 6500 on the first<br />
day of 2021. Can you talk through how that process<br />
is different under a pandemic?<br />
Sino Jet is known as an operator with a very high safety and service<br />
standard. To foster industry development, we initiated and set<br />
up a Private Jet Flight Attendant Committee within the Beijing Business<br />
Aviation Association. As the chairperson, my goal was for the<br />
committee to accelerate knowledge sharing, case studies and field<br />
trips concerning service skills, service standards, cabin safety, crew<br />
resources management and aircraft supplies etc. Meanwhile, our mission<br />
is to provide a bridge between Chinese operators and the government<br />
to ensure a premium service concept, enhance service quality,<br />
create channels for sharing resources within the industry and move<br />
the business aviation industry forward.<br />
We have come to realize that our industry is suffering from a shortage<br />
of talent. We wish to utilize our strengths and resources to nurture<br />
future aviation professionals. Therefore, we set up the “<strong>Sky</strong> But-<br />
Certainly, the new aircraft was delivered last December at Bombardier’s<br />
Montreal headquarters. We made the inaugural flight on the<br />
first day of this year - was very exciting news and represented a good<br />
start to 2021.<br />
We would like to thank our customers for their trust in our values and<br />
our services. As you know, it is very difficult to coordinate aircraft<br />
deliveries overseas during the COVID-19 pandemic. Over the years we<br />
have earned extensive experience delivering aircraft from North America,<br />
and with that knowledge, our client relations management team,<br />
flight operations, and quality assurance departments have developed<br />
a comprehensive delivery plan that considers different scenarios. I<br />
FIRST QUARTER 2021 — ASIAN SKY QUARTERLY | 21
INTERVIEW: SINO JET<br />
What are the plans and objectives of Sino Jet in<br />
2021?<br />
China has done a good job containing the spread of the virus and has<br />
encouraged members of the public to join the COVID-19 vaccination<br />
program. We believe our economy will soon recover. Also, since more<br />
people have realized the advantages of business jets, we expect that<br />
there will be a new group of users in the near future.<br />
ler Elite Training Program” to recruit potential candidates who wish to<br />
pursue their career in the aviation business. We introduce the general<br />
status of business aviation development in the world, the service culture<br />
in China, aircraft models, seasonal operation skills, cabin layout,<br />
luxury food handling, tea art, flower arrangement and wine serving<br />
etc. We provide training to candidates that strive to be top tier corporate<br />
flight attendants.<br />
Sino Jet provides a platform to arrange job interviews for our candidates.<br />
Through a series of professional courses, they can skilfully perform the<br />
duties of a corporate flight attendant. Some students become Sino Jet<br />
team members, while others begin their career with other operators.<br />
According to National 14th Five Year Plan, the Central Government<br />
will support aviation development with various favorable policies.<br />
Sino Jet will be well prepared and will seize the whatever opportunities<br />
there may be.<br />
Sino Jet’s goal is to achieve a sustainable society that helps the<br />
industry improve by maintaining the highest safety standards, premium<br />
services and gaining trust and respect from clients and industry<br />
peers.<br />
www.sinojet.org<br />
Sino Jet is keen on developing more talents and attract fresh blood<br />
into the industry. This is important and necessary to achieve greater<br />
success in the industry.<br />
22 | ASIAN SKY QUARTERLY — FIRST QUARTER 2021
\<br />
BUSINESS AVIATION SIMPLIFIED.<br />
BUSINESS AVIATION FINANCING<br />
FOR THOSE WHO VALUE SIMPLICITY.<br />
Ultimately, business aviation is an exercise in simplicity. The fastest way<br />
to get from here to there. No complications. No delays. Simple.<br />
Unfortunately, the business of business aviation can be complicated—particularly when<br />
it comes to financing. We understand that.<br />
Which is why we provide the most straight-forward, flexible and solutions-oriented<br />
financing experience in the industry—along with the experience and responsiveness<br />
you’d expect from a partner focused exclusively on business aviation financing. With no<br />
complications. And no delays. Simple.<br />
844.436.8200 \ info@globaljetcapital.com \ globaljetcapital.com<br />
LEASING & LENDING SOLUTIONS<br />
FIRST QUARTER 2021 — ASIAN SKY QUARTERLY | 23
INTERVIEW: COMLUX<br />
INTERVIEW: COMLUX<br />
DARON DRYER, CEO OF COMLUX COMPLETION<br />
When did the Indianapolis facility open?<br />
Comlux Completion opened in October 2008. I had the opportunity to<br />
join the team as one of the first employees back in 2009 when I started<br />
as Manager of Mechanical Systems Engineering.<br />
For the past 12 years, we have continuously innovated in the large to<br />
very large bizliner segment by engineering luxury into our cabin completions,<br />
upgrades and refurbishments.<br />
In 2012 we built a state-of-the-art hanger. Today we have established<br />
ourselves as one of the most unique and modern completion & service<br />
centers in the world, with a strong focus on Airbus and Boeing aircraft.<br />
Comlux Completion perfectly complements the other divisions of the<br />
Comlux Group. Headquartered in Switzerland — Comlux Aviation, specializes<br />
in VIP fleet operations, aircraft management and charter services;<br />
and Comlux Transactions — dedicated to VIP Aircraft sales and acquisitions.<br />
We share the same goal “customer at heart, performance in mind”<br />
and we have developed valuable synergies between the different teams.<br />
What services does Comlux Completion Offer?<br />
Comlux is the only Completion and Service/Warranty Centre that holds<br />
both Airbus and Boeing approvals in this hemisphere. As such we<br />
offer a full product line of technical services to include:<br />
• VIP completions<br />
• Major modifications or refurbishments<br />
• Full maintenance capabilities<br />
• In house engineering services (all disciplines on staff)<br />
• In house production and fabrication capabilities<br />
• Pre-buy inspections<br />
• In house interior design support<br />
• AOG support<br />
• Avionic upgrades<br />
• FAA and EASA certification support<br />
What is the largest aircraft that has been worked<br />
on at the facility?<br />
We have completed a full ACJ330 completion in 2019. We have also<br />
performed cabin upgrades for the Comlux 767BBJ <strong>Sky</strong>Lady aircraft.<br />
24 | ASIAN SKY QUARTERLY — FIRST QUARTER 2021
INTERVIEW: COMLUX<br />
YOU WILL COMPLETE THE FIRST ACJ TWOTWENTY,<br />
HOW MUCH PLANNING DOES IT TAKE FOR A NEW<br />
AIRCRAFT TYPE?<br />
The ACJ TwoTwenty program is a full partnership<br />
with Airbus ACJ. Comlux Completion is in charge of<br />
engineering, building and certifying the future VIP<br />
cabin of the first 15 ACJ TwoTwenty’s. We have been<br />
working together on defining the design and developing<br />
innovative engineering solutions for almost<br />
two years already. This is a totally new aircraft on the<br />
market that requires extensive planning internally, as<br />
well as in co-operation with Airbus at every stage of<br />
the program. I am extremely proud of the teamwork<br />
between our teams and the ones of ACJ, and of all the<br />
work that has been accomplished so far. The first aircraft<br />
will arrive in Indianapolis by the end of the year<br />
and is scheduled to enter completion during 2022.<br />
ACJ220 Modern Lounge<br />
How many man hours will it take to complete?<br />
This is still under development. We are taking the time and care<br />
to consider all possible aircraft configurations in advance to ensure<br />
that once the program is mature, we can support our objective<br />
of eight month down time.<br />
What country approvals does the facility have?<br />
We are an approved 145 repair station for the following countries:<br />
• FAA (US)<br />
• EASA (EU)<br />
• Kingdom of Saudi Arabia<br />
• Aruba<br />
• Bermuda<br />
• Brazil<br />
• Cayman Islands<br />
• Kazakhstan<br />
• Korea<br />
These are current approvals; others can be obtained or re-instated as required.<br />
How many aircraft can be worked on at the same time?<br />
Our ultra-modern facility was specifically designed to accommodate<br />
multiple VIP completions or maintenance work. The facility houses<br />
both on site engineering offices and production fabrication capabilities.<br />
Our 157,000sqft/14,600sqm main hangar floor, coupled with<br />
an adjacent maintenance hangar, supports either six narrowbody<br />
aircraft or four narrowbody aircraft and one widebody aircraft.<br />
Are there any plans to expand the facility?<br />
Opportunities to expand are always under consideration but quality<br />
companies expand when there is good reason. “Quality in our business<br />
is never about Quantity”.<br />
Was 2020 busier than normal due to less people<br />
flying their aircraft?<br />
Despite the pandemic, 2020 was a very busy year and that continues<br />
to be the case in 2021. We delivered our first ACJ320neo completions,<br />
and are currently working on two more, with a third due to arrive in<br />
June. We continued our work on the first BBJ max 8 completion ever<br />
to be done and are entering Customer Acceptance Phase as we recently<br />
obtained the first VIP Interior STC for this aircraft type.<br />
We also welcomed several aircraft for maintenance, refurbishment,<br />
and integration of ionisation systems, which aims at purifying the air<br />
against bacteria and viruses via the air conditioning system.<br />
What is the most outlandish thing you have been<br />
asked to do with an interior?<br />
Well, I think everyone has been asked to install a bathtub or Jacuzzi<br />
once or twice in their career. However, an interesting challenge we<br />
were presented with was to install a full gymnasium with weight<br />
machines. We actually accomplished this request and had the entire<br />
installation fully certified. So even the toughest challenges can<br />
be overcome if you sit down, identify the critical elements, and then<br />
innovate to meet the client’s expectations.<br />
www.comlux.com<br />
FIRST QUARTER 2021 — ASIAN SKY QUARTERLY | 25
AIRCRAFT SPOTLIGHT: FALCON 6X<br />
FALCON 6X FLIGHT TEST PROGRAM GATHERS STEAM<br />
ENTRY-INTO-SERVICE PREPARATION ALREADY UNDERWAY<br />
In just under a month following the March 10 first flight of the all-new<br />
Falcon 6X, over 50 hours of flights had been completed. The flight envelope<br />
was opened to Mach .90 — the aircraft’s maximum operating<br />
speed. Four pilots have flown the aircraft, and they have collectively concluded<br />
that so far, it has the nicest landing characteristics of any Falcon.<br />
Dassault Aviation has reason to celebrate, especially after the challenges<br />
of 2020 due to COVID-19. In normal times, meshing a global supply<br />
chain for a new aircraft program is challenging. Keeping it on track<br />
through work shutdowns, slowdowns and shipping delays has been a<br />
major accomplishment for the French aerospace company. Well before<br />
the pandemic, Eric Trappier, Dassault Chairman and CEO, promised the<br />
6X would fly in the first quarter of 2021. The company kept that promise<br />
with a reportedly flawless first flight.<br />
“At this stage of development, we have an aircraft that is demonstrating<br />
system maturity and performing well. All of the testing and simulation<br />
on the ground has really paid off in giving us a robust aircraft for the<br />
flight test program.” Said Ferry.<br />
Ferry reports that a second, fully instrumented, flight test aircraft will<br />
enter the program in a few weeks and that a third aircraft, with a fully<br />
functional interior, will enter the program by summer. Amongst the many<br />
activities for that plane will be thermal mapping of the interior to ensure<br />
proper insulation and excellent temperature control throughout the cabin,<br />
as well as sound mapping to adjust noise reduction materials, if necessary.<br />
The company expects the aircraft to be at least as quiet as the<br />
Falcon 8X, which Dassault says is the quietest business jet flying, with<br />
interior sound levels around 48 dB, equivalent to a living room.<br />
Later in the program a fourth aircraft — the first production aircraft, will fly,<br />
also with a full interior. It will travel around the world, carrying many passengers<br />
who can evaluate all cabin systems, including entertainment systems<br />
and Wi-Fi High-speed internet capability through a Ka-band satellite link.<br />
The 6X flew exactly as predicted by our<br />
models. From a pilot’s perspective, it flies<br />
like a Falcon, which is to say that it flies<br />
with perfect precise handling in all phases<br />
of flight, said test pilot Bruno Ferry.<br />
26 | ASIAN SKY QUARTERLY — FIRST QUARTER 2021
AIRCRAFT SPOTLIGHT: FALCON 6X<br />
The 6X is breaking new ground on many fronts, including, in the view of<br />
leading industrial designers, in terms of interior styling. After winning in<br />
September 2020 the International Yacht & Aviation Award for its cabin<br />
design, the company recently received the prestigious Red Dot award<br />
from a 50-judge panel for the design of the 6X cabin. Previous recipients<br />
include Audi, Porsche and Apple.<br />
A seventh fuselage is already on the assembly line and an eighth will be<br />
delivered to the factory shortly. Certification is expected within 2022,<br />
with deliveries shortly thereafter.<br />
To prepare for global customer operations of the aircraft, the product<br />
support organization has been planning and preparing for years and<br />
has recently increased its activities. The organization plans to have<br />
$100 million of 6X inventory distributed around the world by entry into<br />
service, which is enough to support the first 30 aircraft.<br />
To ensure high reliability from the start, the company has implemented<br />
two new programs: Highly Accelerated Stress Screen (HASS), subjecting<br />
components to extremes of vibration, temperature and humidity); and<br />
Highly Accelerated Life Testing (HALT), a second series of stress tests applied<br />
on production units, if necessary.<br />
Dassault emphasizes not only modern lines and clever features, such<br />
as a skylight in the usually hard-to-illuminate galley area, but also<br />
health features such as a low cabin pressure altitude (1,170 m while<br />
cruising at 12,300 m) and filtered air flow in the cabin. Windows are<br />
about 10 percent larger than on the flagship Falcon 8X. Thirty of them<br />
line the fuselage making the 6X cabin the brightest in business aviation,<br />
according to Dassault.<br />
For all of its new features, the 6X is a traditional Falcon in terms of design<br />
choices to ensure stable low speed handling, the ability to access<br />
short runways, and to fly long distances when taking off from them. As<br />
with all Falcons, the 6X has a combination of large flaps and leading<br />
edge slats to reconfigure the wing for low approach speeds. In fact,<br />
the 6X can fly comfortably at 109 knots on approach, below the typical<br />
approach speed of some smaller turboprops, allowing it to routinely<br />
use runways of 1,200 m or less.<br />
The 6X is the first business jet with a comprehensive maintenance diagnostic<br />
system on board. It is called FalconScan and monitors 100,000<br />
maintenance parameters. It can identify faults and recommend corrective<br />
actions, transmitting this information to the ground so that resources<br />
can be mobilized before the aircraft lands when time is of the essence.<br />
Product Support teams are analyzing FalconScan downloads after each<br />
flight and also running simulation exercises with FalconScan data.<br />
The 6X has the latest and most advanced generation of Dassault’s<br />
digital flight control system (DFCS). Dassault Aviation was the pioneer<br />
in introducing digital flight control technology to business aviation—a<br />
transfer of military technology from its combat aircraft. The Falcon 7X<br />
was the first fly-by-wire Falcon (first flight in 2005), followed by the<br />
8X. In those aircraft, the digital flight control system managed primary<br />
controls—ailerons, elevators, rudder. In the 6X, it manages all controls,<br />
including the slats, flaps and flaperons.<br />
“The 6X is the latest example of the fusion of military know-how and<br />
business aviation expertise for which Dassault Aviation is so respected,”<br />
commented Trappier. “The new capabilities in efficiency, performance<br />
and safety it offers will set a new benchmark in the long-range<br />
segment. This airplane will also set a new standard in terms of cabin<br />
comfort and spaciousness, as demanded by our customers.”<br />
The 6X is a true widebody business jet. The aircraft has the largest<br />
fuselage cross section of any purpose-built business jet. The cabin<br />
height is six-feet, six-inches. The three-zone layout can carry up to<br />
16 passengers, although operators will typically fly with a smaller<br />
number of for more individual comfort. That will usually be the case<br />
on long-range flights. The 6X can fly up to 10,186 km (sufficient<br />
range to fly London to Hong Kong, for example) at Mach .80 or 9,445<br />
km at Mach .85.<br />
All of these capabilities will, of course, be extensively tested in the<br />
months ahead on a flight test program that by all appearances, are off<br />
to a good start.<br />
www.falcon6X.com<br />
FIRST QUARTER 2021 — ASIAN SKY QUARTERLY | 27
THE NEW BATTLEGROUND – ULTRA LONG-RANGE JETS<br />
GULFSTREAM G700, GLOBAL 7500 & FALCON 10X<br />
By the end of 2008, the business jet industry had hit its peak. Flight hours<br />
were the highest they had ever been, and new aircraft deliveries had hit an<br />
all-time high. But having grown rapidly over the course of the preceding<br />
years, the industry would be brought back down to earth quickly when the global<br />
financial crisis hit. Orders for new airplanes, which had been flowing rapidly just the<br />
year before, had not only dried up, but in many cases were completely canceled.<br />
Having delivered a total of just over 1,300 new business jets in 2008, 2009 saw just<br />
874 new jet deliveries.<br />
During the next years deliveries would fall further, although not as sharply as in<br />
2009, but within those deliveries something interesting had happened. Suddenly<br />
there was a huge polarization in the market, and a new word was heard everywhere<br />
from the halls of Bordeaux to the floors of Savannah — bifurcation. Although this<br />
new word had many people reaching for their dictionaries, it was the perfect word<br />
to describe the market at the time, as it had had reached a point that it would split<br />
— with very different fortunes for one end of the market versus the opposite end.<br />
The Very Light Jet (VLJ) sector, which before the crisis had been riding high on a<br />
wave of new aircraft announcements and huge orders, was hit the hardest, with the<br />
years following the global financial crisis seeing many of the new aircraft that were<br />
announced shelved, and all of the mega orders cancelled.<br />
At the top end of the market however, things were steady. Not spectacular, not booming,<br />
just steady. New deliveries were down, as were market values, but not as much<br />
as for the smaller jets. The industry never fully recovered from the crisis, at least not<br />
in terms of new airplane deliveries. In 2019 — the year before the industry suffered<br />
again due to the COVID-19 pandemic, there were just 644 business jet deliveries.<br />
Since the global economic fallout, the big three business jet manufacturers — Bombardier,<br />
Dassault and Gulfstream, have been locked in a battle to build the biggest,<br />
fastest and farthest flying business jet. And one of their biggest battleground markets<br />
is Asia-Pacific where the Ultra-Long Range category represents a third of the<br />
fleet and is the highest growing size category. The big dogs wag their tails in Asia.<br />
The current king of range is Bombardier’s Global<br />
7500, but only by a mere 200nm. In Asia this 200nm<br />
can be lost in a blink of an eye depending on which<br />
jurisdictional fuel reserve policy you have to apply<br />
i.e., US FAA versus China’s CAAC. The Global 7500’s<br />
range is just a touch above the Gulfstream G650ER<br />
and G700s 7,500nm range at 7,700nm. However,<br />
much like when Gulfstream introduced the extended<br />
range version of the baseline G650, can we expect to<br />
see a G700ER announcement several years following<br />
the introduction of the G700?<br />
Meanwhile patiently waiting in the wings, waiting for<br />
the right time to make an announcement, has been<br />
Dassault. The Falcon 6X flew for the first time earlier<br />
in the year and has since been joined by a second<br />
example in the aircraft’s flight test campaign, has the<br />
widest cross section of any business jet currently in<br />
service. Dassault’s design work on the fuselage barrel<br />
meant that the redesign from the Falcon 5X to the Falcon<br />
6X could be achieved without having to go back to<br />
the drawing board completely. But despite not having to<br />
do so, Dassault chose somewhat out of character and<br />
therefore unexpectedly to do exactly that for its newest<br />
flagship business jet – the Falcon 10X.<br />
With the Falcon 10X now officially launched, the Ultra<br />
Long-Range category is now going through what<br />
one would have to say is a serious make over. It is<br />
probably the first that the the Top 3 OEMs have had<br />
simultaneously competing new aircraft on the market<br />
for buyers to consider.<br />
28 | ASIAN SKY QUARTERLY — FIRST QUARTER 2021
THE NEW BATTLEGROUND – ULTRA LONG-RANGE JETS: GULFSTREAM G700, GLOBAL 7500 & FALCON 10X<br />
<strong>Asian</strong> <strong>Sky</strong> Media takes a first look therefore look at the “new” Ultra Long-Range category and compares<br />
as best it can the attributes of the Bombardier Global 7500, Gulfstream G700 and Falcon 10X.<br />
FALCON 10X<br />
GLOBAL 7500<br />
GULFSTREAM G700<br />
Price (USD)<br />
$75 million<br />
$73 million<br />
$75 million<br />
Max Pax<br />
19<br />
19<br />
19<br />
Max Range (nm) @ M0.85<br />
7,500<br />
7,700<br />
7,500<br />
Max Speed (Mach)<br />
0.925<br />
0.925<br />
0.925<br />
Long Range Cruise (Mach)<br />
0.85<br />
0.85<br />
0.85<br />
MTOW (lbs)<br />
115,000<br />
114,850<br />
107,600<br />
Cabin altitude<br />
3,000 ft<br />
4,500 ft<br />
4,850 ft<br />
Cabin Width<br />
2.77 m<br />
2.44 m<br />
2.49 m<br />
Cabin Length<br />
16.7 m<br />
16.61 m<br />
17.35 m<br />
Cabin height<br />
2.03 m<br />
1.88 m<br />
1.91m<br />
Baggage Compartment Volume<br />
5.6 m 3<br />
5.3 m 3<br />
5.52 m 3<br />
Exterior Length<br />
33.4<br />
33.8<br />
33.48<br />
Wingspan<br />
33.6<br />
31.7<br />
31.39<br />
Engines<br />
RR Pearl 10X<br />
GE Passport<br />
RR Pearl 700<br />
Engine Lbf<br />
18,000<br />
18,920<br />
18,250<br />
Avionics Suite<br />
EASy III<br />
Pro Line Fusion<br />
Primus Epic<br />
TO Distance<br />
< 6,000 ft<br />
5,760 ft<br />
6,250 ft<br />
Landing Distance<br />
< 762 m<br />
682 m<br />
762 m<br />
Max operating Altitude (ft)<br />
51,000<br />
51,000<br />
51,000<br />
Entry into service<br />
End of 2025<br />
2018<br />
End of 2022<br />
FIRST QUARTER 2021 — ASIAN SKY QUARTERLY | 29
THE NEW BATTLEGROUND – ULTRA-LONG-RANGE JETS: GULFSTREAM G700, GLOBAL 7500 & FALCON 10X<br />
As can be seen from the table, the reality is, on paper at least, there<br />
is not much difference between the three aircraft. At least not in the<br />
headline stats. All three aircraft share the same maximum speed<br />
and cruise speed, there is only a 200nm range difference between<br />
the three and only a $2 million between them (at 2021 prices).<br />
Both the Falcon 10X and Gulfstream G700 use derivates<br />
of the new Rolls-Royce Pearl engines, whilst<br />
the Global 7500 uses a pair of GE Passport engines.<br />
The GE Passport’s produce more thrust than the<br />
Rolls-Royce engines, however the Pearl 10Xs have a<br />
10-stage compressor, and 4-stage low pressure turbine,<br />
which is predicted to reduce fuel burn by 5% over<br />
other derivative engines. The engines have already<br />
been tested using 100% sustainable aviation fuel<br />
(SAF), with Rolls-Royce stating that it is 100% committed<br />
to helping SAF become certified for use.<br />
Bombardier Global 7500<br />
Upfront, each manufacturer has a different vision of<br />
a cockpit, with each using an existing avionics suite<br />
and then adding its own touches. On the G700, Gulfstream’s<br />
Symmetry flight deck is based on Honeywell’s<br />
Primus Epic avionics suite, which is the same as the<br />
manufacturer uses on its G500 and G600 business<br />
jets. On the Global 7500, Bombardier’s Vision Flight<br />
Deck, which is based on the Collins Aerospace Pro<br />
Line Fusion avionics suite, is an updated version of<br />
the flight deck from the Global 6500. Dassault’s latest<br />
EASy III flight deck that will feature on the Falcon<br />
10X is also based on Honeywell’s Primus Epic avionics<br />
suite, but Dassault has decided to implement<br />
some new features like touch screens, a single Smart<br />
Momo Throttle and a Recovery button inherited from<br />
its combat proven fighter jets.<br />
Gulfstream G700<br />
All three aircraft use sidestick controls, rather than the<br />
traditional yoke type controls that are seen in older generation<br />
aircraft. For the G700 these are active, meaning<br />
that when the pilot in command moves his stick, the<br />
stick of the other pilot mirrors the movement. The Falcon<br />
10X will be flown with its renowned Smart Sidestick<br />
already installed on Falcon 7X, Falcon 6X and Falcon 8X,<br />
as well as on the Rafale fighter jet and Neurone (Drone).<br />
The Global 7500 incorporates a different philosophy<br />
with any input on either stick not being mirrored on the<br />
other. The philosophies of each OEM continues to differ<br />
when it comes to side stick controls. As an example, the<br />
Global 7500 and Falcon 10X systems handle all moving<br />
surfaces, while the G700 is limited to main surfaces.<br />
Dassault Falcon 10X<br />
The wings are a major element of any aircraft as<br />
they sustain the aircraft in flight and permit operational<br />
benefits like accessibility to certain airports. In<br />
this area the Falcon 10X has distinguishing itself by<br />
bringing a first to business Aviation: 100% composite<br />
wings, made possible due to Dassault Aviation’s design<br />
and manufacturing expertise on the Rafale.<br />
30 | ASIAN SKY QUARTERLY — FIRST QUARTER 2021
THE NEW BATTLEGROUND – ULTRA-LONG-RANGE JETS: GULFSTREAM G700, GLOBAL 7500 & FALCON 10X<br />
Dassault Falcon 10X Cabin Design<br />
But for the passengers in the back, the people most likely to be paying<br />
for the aircraft, the big differences are in the cabin, both in the dimensions<br />
as well the cabin altitude. These are both very important factors,<br />
as many manufacturers and brokers will tell you that it is the cabin that<br />
sells the aircraft.<br />
So, very significantly, it is with the<br />
cabin that the Falcon 10X leaps to the<br />
forefront. When it comes to cabin height,<br />
the Falcon 10X, being just over 2 meters,<br />
is another first in business aviation, not<br />
including corporate airliners. The same<br />
is true when it comes to the cabin width,<br />
the Falcon 10X is the widest, at 2.77m, so<br />
quite a bit more than its competitors.<br />
The additional width and height in the 10X cabin will be especially noticeable<br />
on longer flights. The Falcon 10X can fly for 7,500nm, which<br />
roughly translates to 15 – 16 hours flying time and a wider cabin<br />
helps the aircraft feel less claustrophobic during those long hours.<br />
The Falcon 10X also has the lowest cabin altitude of any business<br />
jet, not just in the ultra-long-range sector, and by quite a long way at<br />
3,000ft. This means that even when the Falcon 10X is flying at its<br />
maximum altitude of 45,000ft, the pressurization inside the cabin is<br />
the same as if the aircraft was flying at 3,000ft. This helps keep the<br />
pressure on the human body low and reduces stress and the feelings<br />
of tiredness and jet lag.<br />
Often in markets it is the first mover than has the advantage, but<br />
that is not always the case in business aviation. By taking its time,<br />
Dassault has had time to refine the 10X. It has also had time to<br />
listen to what its existing customers, and potential new customers,<br />
want. They wanted the range, and they wanted the speed, but most<br />
of all, they wanted a comfortable cabin so that they could feel at<br />
feel at ease for 16 hours. The Falcon 10X delivers on all three, and<br />
is worth the wait.<br />
This combined cabin cross section, the total space & aisle distances<br />
allow Falcon to introduce new seats, individual seats around the conference<br />
table, private suites and even a king size bed amongst many<br />
other new features.<br />
FIRST QUARTER 2021 — ASIAN SKY QUARTERLY | 31
SPECIAL FEATURE<br />
ASIA-PACIFIC BUSINESS JET FLIGHT ACTIVITY<br />
2021 Q1 REVIEW<br />
WINGX is a data research and consulting company, which provides<br />
actionable market intelligence to the global business aviation<br />
industry. Our interactive web-hosted dashboards provide our<br />
customers with the data-visualization they need to stay alert to<br />
market trends, keep tabs on market share, identify competitive<br />
threats and spot new sales opportunities. WINGX customers<br />
include aircraft operators, airframe, engine and avionics OEMs,<br />
airlines, maintenance providers, airports, fixed-based operators,<br />
satcom providers, fuel providers, legal advisors, leasing companies,<br />
banks, regulators, investors and private jet users.<br />
For further information and a free demo of our dashboards, please<br />
contact: Richard or Christoph at office@wingx-advance.com<br />
32 | ASIAN SKY QUARTERLY — FIRST QUARTER 2021<br />
WINGX Data Source: ADSB and ATC<br />
DATA BY
SPECIAL FEATURE: ASIA-PACIFIC FLIGHT ACTIVITY - <strong>2021Q1</strong><br />
According to data from German business aviation consultancy<br />
WingX Advance, the total number of business aviation flights departing<br />
from Asia-Pacific between January 2020 and March 2021<br />
was 103,904 – a 12.5% drop when compared to January 2019 to<br />
March 2020. The decline in flight activity is due to restrictions<br />
put in place by governments around the world to try and slow the<br />
spread of COVID-19.<br />
Flight activities in the first two months of 2021 were slightly lower<br />
than in the same period in 2019; however, the number of departures<br />
in March 2021 was 9,435 - 65.7% more than in March 2020.<br />
The drastic growth in March 2021 indicated that flight activity is<br />
gradually recovering to pre-pandemic levels.<br />
FLIGHTS DEPARTING APAC<br />
2020-2021 Departures YoY Trend<br />
65.7%<br />
14.9%<br />
8,759<br />
-0.5%<br />
7,702<br />
-36.1%<br />
5,706<br />
-68.9%<br />
-53.0%<br />
-34.8%<br />
5,110<br />
-19.7%<br />
6,121<br />
-12.6%<br />
6,903<br />
-10.3%<br />
7,178<br />
-7.7% -3.6%<br />
-14.8%<br />
8,802<br />
7,776 7,886<br />
-3.4% -2.5%<br />
8,447<br />
7,504<br />
9,435<br />
3,796<br />
2,779<br />
Jan<br />
20<br />
Feb<br />
20<br />
Mar<br />
20<br />
Apr<br />
20<br />
May<br />
20<br />
Jun<br />
20<br />
Jul<br />
20<br />
Aug<br />
20<br />
Sep<br />
20<br />
Oct<br />
20<br />
Nov<br />
20<br />
Dec<br />
20<br />
Jan<br />
21<br />
Feb<br />
21<br />
Mar<br />
21<br />
Aside from mainland China and India, which<br />
saw increases of 13% and 3% respectively,<br />
all other countries saw decreased flight<br />
activities, albeit to different extents. Singapore,<br />
still the country thats flight activity<br />
has been the most impacted by the<br />
COVID-19 pandemic, saw a year-on-year<br />
drop of 52%. Overall, flight activity began<br />
to rebound in May 2020, with a continuous<br />
upward trend until the first quarter of 2021.<br />
DEPARTURES BY MONTH - 2019 VS. 2020<br />
2019-2020 Dep. 2020-2021 Dep.<br />
400<br />
350<br />
300<br />
250<br />
REGION DEP. FLIGHTS YOY TREND<br />
Mainland China<br />
11470<br />
13%<br />
200<br />
India<br />
10445<br />
3%<br />
150<br />
Japan<br />
4661<br />
-30%<br />
Malaysia<br />
3189<br />
-16%<br />
100<br />
Thailand<br />
2774<br />
-16%<br />
50<br />
Hong Kong<br />
2595<br />
-32%<br />
Singapore<br />
1938<br />
-52%<br />
0<br />
Mar<br />
Apr<br />
May<br />
Jun<br />
Jul<br />
Aug<br />
Sep<br />
Oct<br />
Nov<br />
Dec<br />
Jan<br />
Feb<br />
Mar<br />
FIRST QUARTER 2021 — ASIAN SKY QUARTERLY | 33
SPECIAL FEATURE: ASIA-PACIFIC FLIGHT ACTIVITY - <strong>2021Q1</strong><br />
FLIGHT DURATION: 2020-2021<br />
10000<br />
More than 5 hours<br />
8000<br />
4 to 5 hours<br />
3 to 4 hours<br />
6000<br />
2 to 3 hours<br />
4000<br />
1 to 2 hours<br />
2000<br />
0<br />
30 min. to 1 hours<br />
Max 30 min.<br />
Jan<br />
20<br />
Feb<br />
20<br />
Mar<br />
20<br />
Apr<br />
20<br />
May<br />
20<br />
Jun<br />
20<br />
Jul<br />
20<br />
Aug<br />
20<br />
Sep<br />
20<br />
Oct<br />
20<br />
Nov<br />
20<br />
Dec<br />
20<br />
Jan<br />
21<br />
Feb<br />
21<br />
Mar<br />
21<br />
During the first quarter of 2021, long-haul flights were still impacted<br />
by the COVID-19 pandemic, although flights lasting for less than three<br />
hours had recovered to similar levels to those before it began. Despite<br />
the initial shock to the industry, by March 2021 flight activity had begun<br />
to surpass pre-pandemic levels.<br />
After the outbreak of COVID-19, domestic flights gradually became<br />
more dominant than international flights in Asia-Pacific. Overall, domestic<br />
flights accounted for 45% of total flight activities during the<br />
period from January 2020 to March 2021, compared to only 34% of<br />
flights between January 2019 and March 2020.<br />
The graph shows that flight activity in mainland China and India have<br />
already recovered from the COVID-19 pandemic. However, the other regions<br />
are stil trying to recover. During the first quarter of 2021, Japan,<br />
Malaysia and Thailand were on their way to rebounding, whilst Hong<br />
Kong and Singapore were still struggling.<br />
2019 Jan - 2020 Mar<br />
2020 Jan - 2021 Mar<br />
INTERNATIONAL VS. DOMESTIC FLIGHTS<br />
Domestic Flights<br />
34%, 41,029<br />
45%, 46,877<br />
International Flights<br />
66%, 80,540<br />
55%, 56,885<br />
0 20,000 40,000 60,000 80,000 100,000<br />
120,000 140,000<br />
FLIGHT ACTIVITY: 2020-2021<br />
4000<br />
3500<br />
3000<br />
2500<br />
Thailand<br />
Singapore<br />
Malaysia<br />
2000<br />
India<br />
1500<br />
1000<br />
Japan<br />
Hong Kong<br />
500<br />
Mainland China<br />
0<br />
Jan<br />
20<br />
Feb<br />
20<br />
Mar<br />
20<br />
Apr<br />
20<br />
May<br />
20<br />
Jun<br />
20<br />
Jul<br />
20<br />
Aug<br />
20<br />
Sep<br />
20<br />
Oct<br />
20<br />
Nov<br />
20<br />
Dec<br />
20<br />
Jan<br />
21<br />
Feb<br />
21<br />
Mar<br />
21<br />
34 | ASIAN SKY QUARTERLY — FIRST QUARTER 2021
SPECIAL FEATURE: ASIA-PACIFIC FLIGHT ACTIVITY - <strong>2021Q1</strong><br />
FLIGHT ACTIVITY TREND: 2020 VS. 2019<br />
Jan - Dec - Mar<br />
250%<br />
200%<br />
150%<br />
100%<br />
50%<br />
0%<br />
-50%<br />
-100%<br />
Mainland China Hong Kong Japan India Malaysia Singapore Thailand<br />
Mainland China has seen a continuous year-on-year rise since August<br />
2020 and was the only country to perform well in the first quarter. In<br />
March alone, mainland China and India saw huge year-on-year increas-<br />
es in flight activities equivalent to a rate of 225% and 102%, respectively.<br />
By contrast, Hong Kong, Japan, and Singapore have experienced<br />
long-lasting year-on-year drops since the outbreak of COVID-19.<br />
FLIGHT DURATIONS IN GREATER CHINA<br />
1600<br />
1400<br />
1200<br />
More than 5 hours<br />
4 to 5 hours<br />
3 to 4 hours<br />
1000<br />
800<br />
2 to 3 hours<br />
600<br />
400<br />
1 to 2 hours<br />
200<br />
0<br />
30 min. to 1 hours<br />
Max 30 min.<br />
Jan<br />
20<br />
Feb<br />
20<br />
Mar<br />
20<br />
Apr<br />
20<br />
May<br />
20<br />
Jun<br />
20<br />
Jul<br />
20<br />
Aug<br />
20<br />
Sep<br />
20<br />
Oct<br />
20<br />
Nov<br />
20<br />
Dec<br />
20<br />
Jan<br />
21<br />
Feb<br />
21<br />
Mar<br />
21<br />
FIRST QUARTER 2021 — ASIAN SKY QUARTERLY | 35
SPECIAL FEATURE: ASIA-PACIFIC FLIGHT ACTIVITY - <strong>2021Q1</strong><br />
GREATER CHINA PERFORMANCE 2020 JAN - 2021 MAR<br />
Mainland China Hong Kong Taiwan Macau<br />
1600<br />
1400<br />
1200<br />
1000<br />
800<br />
600<br />
400<br />
200<br />
0<br />
Jan<br />
20<br />
Feb<br />
20<br />
Mar<br />
20<br />
Apr<br />
20<br />
May<br />
20<br />
Jun<br />
20<br />
Jul<br />
20<br />
Aug<br />
20<br />
Sep<br />
20<br />
Oct<br />
20<br />
Nov<br />
20<br />
Dec<br />
20<br />
Jan<br />
21<br />
Feb<br />
21<br />
Mar<br />
21<br />
From the graph, half of the top OEMs experienced a year-on-year<br />
rise in flight activity. Cessna increased by 24% mainly due to the<br />
major recovery in mainland China and India. In addition, although<br />
Honda ranked last amongst the top OEMs, its flight activities grew<br />
by 138%. This was due to a 168.6% year-on-year rise in Japan and<br />
87.5% growth in the Philippines.<br />
On the other hand, ultra-long range jet activity decreased by 36%<br />
when compared to the previous period, as India, Indonesia, and<br />
Japan saw year-on-year drops of 31.6%, 31.9%, and 66.7%, respectively.<br />
By contrast, midsize jet flight activity grew 27% due to the<br />
141.3%, 137.6%, and 52.3% year-on-year rises in South Korea, India,<br />
and Indonesia, respectively.<br />
TOP OEM FLEET ACTIVITIES YOY%<br />
Flights YoY %<br />
138%<br />
29,639<br />
24,888<br />
84%<br />
7%<br />
24%<br />
10%<br />
-18%<br />
-31%<br />
12,271<br />
11,410<br />
-24%<br />
9,358<br />
-42%<br />
-50%<br />
7,205<br />
3,571<br />
2,350 2,136<br />
714<br />
Bombardier<br />
Gulfstream<br />
Embraer<br />
Cessna<br />
Dassault<br />
Hawker<br />
Beechcraft<br />
Learjet<br />
Airbus<br />
Boeing<br />
Honda<br />
36 | ASIAN SKY QUARTERLY — FIRST QUARTER 2021
SPECIAL FEATURE: ASIA-PACIFIC FLIGHT ACTIVITY - <strong>2021Q1</strong><br />
The busiest hub in Asia-Pacific was Beijing during the first quarter<br />
of 2021. Compared to the first quarter of 2020, flight activity in Hong<br />
Kong, Taipei, Tokyo and Singapore in the first quarter of 2021 was<br />
notably down. On the other hand, flight activities in Beijing, Shanghai<br />
and Guangzhou all saw substantial year-on-year rises both in February<br />
and March 2021. In addition, Bangkok and Taipei saw yearon-year<br />
increases in March 2020, whilst Hong Kong, Singapore and<br />
Tokyo all saw year-on-year drops.<br />
TOP AVIATION HUB FLIGHT ACTIVITY TRENDS 2020<br />
Departing Flights YoY %<br />
BEIJING<br />
108%<br />
HONG KONG<br />
45%<br />
76%<br />
-3% -3%<br />
-16%<br />
-10%<br />
-17%<br />
201<br />
-32%<br />
-53%<br />
-63% -65% -54% -51% -69%<br />
165<br />
-18% -20% -13% -16%<br />
182 178<br />
196 198<br />
-17%<br />
164<br />
167<br />
177<br />
334<br />
254<br />
270<br />
-57%<br />
-42%<br />
-33%<br />
-40%<br />
-62%<br />
-41% -37% -63%<br />
-56% -54%<br />
95<br />
85<br />
56<br />
81<br />
92<br />
105<br />
114<br />
139<br />
185<br />
156<br />
186<br />
154<br />
108<br />
152<br />
185<br />
123<br />
111<br />
124<br />
Jan<br />
20<br />
Feb<br />
20<br />
Mar<br />
20<br />
Apr<br />
20<br />
May<br />
20<br />
Jun<br />
20<br />
Jul<br />
20<br />
Aug<br />
20<br />
Sep<br />
20<br />
Oct<br />
20<br />
Nov<br />
20<br />
Dec<br />
20<br />
Jan<br />
21<br />
Feb<br />
21<br />
Mar<br />
21<br />
Jan<br />
20<br />
Feb<br />
20<br />
Mar<br />
20<br />
Apr<br />
20<br />
May<br />
20<br />
Jun<br />
20<br />
Jul<br />
20<br />
Aug<br />
20<br />
Sep<br />
20<br />
Oct<br />
20<br />
Nov<br />
20<br />
Dec<br />
20<br />
Jan<br />
21<br />
Feb<br />
21<br />
Mar<br />
21<br />
SHANGHAI<br />
TOKYO<br />
172%<br />
27% 28%<br />
28%<br />
201<br />
-21%<br />
-43%<br />
-60%<br />
-67% -71%<br />
1%<br />
26%<br />
165<br />
-11% -8%<br />
-22%<br />
178<br />
182<br />
18%<br />
198<br />
51%<br />
-8%<br />
164<br />
177<br />
218<br />
222<br />
-56%<br />
-70%<br />
-79%<br />
-49%<br />
-59%<br />
-73% -73%<br />
-63%<br />
-31%<br />
-75% -73% -67% -72%<br />
95<br />
85<br />
56 81<br />
92<br />
105<br />
196<br />
167<br />
94<br />
46<br />
52<br />
79<br />
62<br />
52 56<br />
79<br />
65 65<br />
71<br />
62 63<br />
Jan<br />
20<br />
Feb<br />
20<br />
Mar<br />
20<br />
Apr<br />
20<br />
May<br />
20<br />
Jun<br />
20<br />
Jul<br />
20<br />
Aug<br />
20<br />
Sep<br />
20<br />
Oct<br />
20<br />
Nov<br />
20<br />
Dec<br />
20<br />
Jan<br />
21<br />
Feb<br />
21<br />
Mar<br />
21<br />
Jan<br />
20<br />
Feb<br />
20<br />
Mar<br />
20<br />
Apr<br />
20<br />
May<br />
20<br />
Jun<br />
20<br />
Jul<br />
20<br />
Aug<br />
20<br />
Sep<br />
20<br />
Oct<br />
20<br />
Nov<br />
20<br />
Dec<br />
20<br />
Jan<br />
21<br />
Feb<br />
21<br />
Mar<br />
21<br />
FIRST QUARTER 2021 — ASIAN SKY QUARTERLY | 37
SPECIAL FEATURE: ASIA-PACIFIC FLIGHT ACTIVITY - <strong>2021Q1</strong><br />
GUANGZHOU<br />
BANGKOK<br />
114%<br />
29%<br />
103%<br />
27%<br />
47<br />
-45%<br />
0%<br />
-33% -30% 40<br />
36%<br />
57<br />
26%<br />
14% 16%<br />
67<br />
54<br />
49<br />
77<br />
50%<br />
81<br />
88%<br />
-3% 6%<br />
60<br />
50<br />
45<br />
62<br />
-1%<br />
-26%<br />
-40%<br />
-54% -55%<br />
-19%<br />
-26%<br />
-6%<br />
-4%<br />
-27%<br />
-32%<br />
130<br />
-52%<br />
10%<br />
-48%<br />
172<br />
182<br />
142<br />
131<br />
99<br />
24<br />
29<br />
30<br />
67 72<br />
87<br />
91<br />
80<br />
109<br />
44 44 46<br />
Jan<br />
20<br />
Feb<br />
20<br />
Mar<br />
20<br />
Apr<br />
20<br />
May<br />
20<br />
Jun<br />
20<br />
Jul<br />
20<br />
Aug<br />
20<br />
Sep<br />
20<br />
Oct<br />
20<br />
Nov<br />
20<br />
Dec<br />
20<br />
Jan<br />
21<br />
Feb<br />
21<br />
Mar<br />
21<br />
Jan<br />
20<br />
Feb<br />
20<br />
Mar<br />
20<br />
Apr<br />
20<br />
May<br />
20<br />
Jun<br />
20<br />
Jul<br />
20<br />
Aug<br />
20<br />
Sep<br />
20<br />
Oct<br />
20<br />
Nov<br />
20<br />
Dec<br />
20<br />
Jan<br />
21<br />
Feb<br />
21<br />
Mar<br />
21<br />
SINGAPORE<br />
TAIPEI<br />
7%<br />
3%<br />
3%<br />
-4%<br />
-19%<br />
-19%<br />
305<br />
-33%<br />
-33%<br />
248<br />
-58%<br />
-68%<br />
-50%<br />
-56%<br />
-54%<br />
-58%<br />
-62%<br />
-57%<br />
81<br />
-43% -52%<br />
-66%<br />
-60% -64% -58% -59%<br />
140<br />
-88%<br />
39<br />
82<br />
105<br />
96<br />
139 142<br />
-70%<br />
101<br />
115 123<br />
-66%<br />
-72%<br />
135<br />
84 84<br />
40<br />
33<br />
-79%<br />
18<br />
28<br />
-73%<br />
22<br />
42<br />
-74%<br />
24<br />
40<br />
34 33<br />
30<br />
33<br />
27<br />
34<br />
Jan<br />
Feb<br />
Mar<br />
Apr<br />
May<br />
Jun<br />
Jul<br />
Aug<br />
Sep<br />
Oct<br />
Nov<br />
Dec<br />
Jan<br />
Feb<br />
Mar<br />
Jan<br />
Feb<br />
Mar<br />
Apr<br />
May<br />
Jun<br />
Jul<br />
Aug<br />
Sep<br />
Oct<br />
Nov<br />
Dec<br />
Jan<br />
Feb<br />
Mar<br />
20<br />
20<br />
20<br />
20<br />
20<br />
20<br />
20<br />
20<br />
20<br />
20<br />
20<br />
20<br />
21<br />
21<br />
21<br />
20<br />
20<br />
20<br />
20<br />
20<br />
20<br />
20<br />
20<br />
20<br />
20<br />
20<br />
20<br />
21<br />
21<br />
21<br />
38 | ASIAN SKY QUARTERLY — FIRST QUARTER 2021
FIRST QUARTER 2021 — ASIAN SKY QUARTERLY | 39
PRE-OWNED MARKET SPOTLIGHT<br />
GLOBAL XRS AND GLOBAL 6000<br />
The original Global Express was first announced during the 1991 NBAA show. At the time,<br />
Bombardier’s Challenger 600 series aircraft was the biggest, and furthest flying business<br />
jets that the Canadian manufacturer was building. But Bombardier’s customers wanted<br />
more. Whilst the Challenger 600 series are great aircraft, they lacked the range to fly ultra-long<br />
distances. The Global Express was launched to solve that problem, with the aim of being able to<br />
fly from any two points on the globe, with only one fuel stop.<br />
Although the Global Express shares the same fuselage cross section as the 1,000+ selling CRJ<br />
series of regional jets, it differs from the CRJ by having a newly designed supercritical wing,<br />
and a new tail structure. At its time of release, the Global Express had the furthest range of any<br />
purpose-built business jet, with its ability to fly a maximum of 6,000nm trumping its closest rival,<br />
the Gulfstream IV, by a long way. Gulfstream would soon reply to the Global Express with the<br />
launch of the Gulfstream V.<br />
Bombardier would later launch the Global Express XRS – an updated variant that included an<br />
increase in range thanks to an additional fuel tank inserted at the wing root. This helped increase<br />
the Global XRS’s range over the baseline Global Express by just over 300nm. Other improvements<br />
included an updated cabin and increased maximum cruise speed.<br />
The Global 6000 was introduced in 2012 and is a rebranded Global Express with a few several key<br />
upgrades. The upgrades include an updated cockpit that features the Rockwell Collins Pro Line<br />
Fusion avionics suite.<br />
40 | ASIAN SKY QUARTERLY — FIRST QUARTER 2021
PRE-OWNED MARKET SPOTLIGHT: GLOBAL XRS & GLOBAL 6000<br />
ACTIVE FLEET BY DELIVERY YEAR<br />
Global EXP Global XRS Global 6000 Global 5000 Global 5500 Global 6500 Global 7500<br />
80<br />
70<br />
60<br />
50<br />
40<br />
30<br />
20<br />
10<br />
0<br />
1998 1999 2000 2001 2002 2003 2004 2005 2006 2007 2008 2009 2010 2011 2012 2013 2014 2015 2016 2017 2018 2019 2020 2021<br />
Data Source: AMSTAT<br />
Fleet Distribution<br />
Over 160 Global XRS and 310 Global 6000s have been delivered to<br />
customers all over the world. The highest number of Global XRS<br />
deliveries in a single year took place in 2010, whilst for the Global<br />
6000 it was 2015.<br />
The Global family had been one of the most important product lines<br />
for Bombardier before it divested itself of its other aviation and transportation<br />
assets so that it could focus entirely on business aviation.<br />
The Global 7500 saw its first delivery take place in 2018 and was delivered<br />
in good numbers in 2020 – giving it a good start on Gulfstream’s<br />
G600 & G700.<br />
Given the Global family’s trans-Atlantic capabilities, North America<br />
and Western Europe are the top operating areas for the XRS<br />
and 6000, whilst Asia comes third place, with majority of its fleet<br />
based in Greater China market (Hong Kong, and mainland China).<br />
OPERATION AREA<br />
REGION GLOBAL XRS GLOBAL 6000 GRAND TOTAL<br />
N. America<br />
W. Europe<br />
Asia<br />
76<br />
39<br />
15<br />
123<br />
107<br />
42<br />
199<br />
146<br />
57<br />
According to ASG’s 2020 Business Jet Fleet Report, at the end of<br />
2020, there were 17 Global 6000s based in Hong Kong, 16 based in<br />
mainland China, and two in Taiwan. Australia has the second largest<br />
fleet in in Asia-Pacific, with 11 Global XRS and four Global 6000<br />
aircraft in operation.<br />
On operator side, according to Amstat, VistaJet and NetJets are<br />
the largest operators internationally. For Greater China, operators<br />
include TAG Asia, Lily Jet, BAA and Bellawings.<br />
Pre-owned Market Status<br />
The average age for XRS fleet in operation is over ten years, whilst the<br />
Global 6000 has just reached the five years threshold. Both models<br />
have now entered their active pre-owned market age group. Despite<br />
its current active state in the market, we estimate that supply will<br />
fluctuate in the future.<br />
Before 2020 the supply for both the XRS and Global 6000 had been<br />
relatively stable, with 10-15 aircraft of each model actively in the market.<br />
Since the pandemic, much like its competitors, supply has been<br />
building up. In the first quarter of 2021 there were a total of 19 Global<br />
XRS aircraft for sale - 11.8% of the total fleet. For the Global 6000,<br />
there were 22 aircraft for sale – 6.7% of the total fleet. The inventory<br />
level of both models is higher than for the Gulfstream G550, which is<br />
currently between 4-5%.<br />
Mid. East/Africa<br />
Australia/Oceania<br />
E. Europe / W. Asia<br />
S./C. America<br />
Grand Total<br />
13<br />
11<br />
4<br />
2<br />
160<br />
17<br />
6<br />
10<br />
9<br />
314<br />
30<br />
17<br />
14<br />
11<br />
474<br />
Data Source: AMSTAT<br />
Over the past year, we have seen sellers mainly from the US and Europe,<br />
and buyers mostly from the US and Asia. Between 2017-2020 there was<br />
a stable market for the both the Global XRS and Global 6000, with an<br />
average of 2-3 transactions taking place in each month for each model.<br />
However, since the onset of the COVID-19 pandemic we have seen a<br />
sharp increase in the number of Global 6000 transactions, with an average<br />
of 4-6 transactions each month since Q2 2020.<br />
FIRST QUARTER 2021 — ASIAN SKY QUARTERLY | 41
PRE-OWNED MARKET SPOTLIGHT: GLOBAL XRS & GLOBAL 6000<br />
MARKET CONDITION: GLOBAL XRS (INVENTORY VALUE, FLEET FOR SALE & TRANSACTIONS)<br />
GL XRS Aircraft For Sale<br />
GL XRS No. of AC Sold<br />
GL XRS Inventory Value<br />
350<br />
50<br />
Inventory Value<br />
(Avg. Asking Price x Total Fleet for Sale) Million USD<br />
300<br />
250<br />
200<br />
150<br />
100<br />
50<br />
0<br />
Mar17<br />
May17<br />
Jul17<br />
Sep17<br />
Nov17<br />
Jan18<br />
Mar18<br />
May18<br />
Jul18<br />
Sep18<br />
Nov18<br />
Jan19<br />
Mar19<br />
May19<br />
Jul19<br />
Sep19<br />
Nov19<br />
Jan20<br />
Mar20<br />
May20<br />
Jul20<br />
Sep20<br />
Nov20<br />
Jan21<br />
Mar21<br />
45<br />
40<br />
35<br />
30<br />
25<br />
20<br />
15<br />
10<br />
5<br />
0<br />
Aircraft For Sale / Transactions<br />
MARKET CONDITION: GLOBAL 6000 (INVENTORY VALUE, FLEET FOR SALE & TRANSACTIONS)<br />
GL6000 Aircraft For Sale<br />
GL6000 No. of AC Sold<br />
GL 6000 Inventory Value<br />
800<br />
50<br />
Million USD<br />
700<br />
600<br />
45<br />
40<br />
35<br />
Inventory Value<br />
(Avg. Asking Price x Total Fleet for Sale)<br />
500<br />
400<br />
300<br />
200<br />
100<br />
0<br />
Mar17<br />
May17<br />
Jul17<br />
Sep17<br />
Nov17<br />
Jan18<br />
Mar18<br />
May18<br />
Jul18<br />
Sep18<br />
Nov18<br />
Jan19<br />
Mar19<br />
May19<br />
Jul19<br />
Sep19<br />
Nov19<br />
Jan20<br />
Mar20<br />
May20<br />
Jul20<br />
Sep20<br />
Nov20<br />
Jan21<br />
Mar21<br />
30<br />
25<br />
20<br />
15<br />
10<br />
5<br />
0<br />
Aircraft For Sale / Transactions<br />
Data Source: Amstat, Guardian Jet and <strong>Asian</strong> <strong>Sky</strong> Group<br />
42 | ASIAN SKY QUARTERLY — FIRST QUARTER 2021
PRE-OWNED MARKET SPOTLIGHT: GLOBAL XRS & GLOBAL 6000<br />
Based on ASG’s market records, since 2017 the Global XRS’s average<br />
asking price has decreased from $20 million to around $15 million<br />
today – around a 25% decrease over four years. The price trend also<br />
shows that the asking values for the Global XRS and Global 6000 have<br />
been consistently below that of its competitors, the G550 and Falcon<br />
7X, making it a viable option among price sensitive operators. Over the<br />
past three years, and taking into account the natural aging of the Global<br />
6000 fleet, its average asking price trend varied from $35-$40 million, to<br />
the $25-$30 million price range that it is currently.<br />
The average time to sell a Global XRS / 6000 takes from six months to<br />
one year - a bit longer than G550 which is usually five to ten months.<br />
However, any transaction depends on the aircraft’s age, configuration,<br />
equipment, and maintenance status. So the time on market could be longer,<br />
or shorter.<br />
Over 70% of the current fleet (both XRS and 6000) for sale are enrolled<br />
on an engine maintenance program, with nearly all recent transactions<br />
also being enrolled.<br />
ULTRA LONG RANGE MARKET - AVERAGE ASKING PRICES (GLOBAL 6000 & XRS VS. G550 & FALCON 7X)<br />
GL6000<br />
GL XRS<br />
G550<br />
F7X<br />
Avg Asking Price<br />
Average Asking Price Million USD<br />
40<br />
35<br />
30<br />
25<br />
20<br />
15<br />
10<br />
Mar21<br />
Jan21<br />
Nov20<br />
Sep20<br />
Jul20<br />
May20<br />
Mar20<br />
Jan20<br />
Nov19<br />
Sep19<br />
Jul19<br />
May19<br />
Mar19<br />
Jan19<br />
Nov18<br />
Sep18<br />
Jul18<br />
May18<br />
Mar18<br />
Jan18<br />
Nov17<br />
Sep17<br />
Jul17<br />
May17<br />
Mar17<br />
Residual Value and Pricing Strategy<br />
Forecast for Global XRS / Global 6000<br />
According to Vref, for a 2015 delivered Global 6000 with a residual value<br />
between $20-$23 million, the annual depreciation rate will be over<br />
10%. For a 2010 Global XRS, its current residual value varies between<br />
$12.8–$14.5 million, with an annual depreciation rate of around 7%.<br />
From what we have seen in the market, sellers / owners expectations<br />
for selling Global’s are often high and far from the market reality. We<br />
have seen many XRS / 6000 listed on market with a high asking price<br />
but no solid enquiry / lead for a long time. Eventually the owner/seller<br />
has to reduce the pricing by millions – In many cases we have seen<br />
a reduction in asking price of between $4-$5 million over the course<br />
of a year.<br />
The fourth quarter of 2020 saw a surge in activity that capped off an<br />
already very active year for Global transactions. With business aviation<br />
in recovery, it is foreseeable that the demand for the Global 6000<br />
and XRS will remain strong. But in the long run, the Global XRS and<br />
Global 6000 market supply will continue to increase, which will have<br />
a negative impact on pricing.<br />
FIRST QUARTER 2021 — ASIAN SKY QUARTERLY | 43
AMSTAT GLOBAL PRE-OWNED MARKET UPDATE<br />
MARKET UPDATE Q1 2021 BY AMSTAT<br />
Andrew Young, AMSTAT General Manager said, “combining the AMSTAT market statistics<br />
and the aircraft value data created by the AMSTAT Aircraft Valuation Tool, empowers<br />
AMSTAT clients with the ability to see the complete market picture.” Adding, “rising resale<br />
transaction activity, contracting inventory and recovering values are all positive signs for<br />
the global business aircraft resale market.”<br />
Heavy Jet Short Term Median Value<br />
HEAVY JET SHORT TERM MEDIAN VALUE<br />
April 2020 – April 2021 % Value Change<br />
Increase<br />
5%<br />
Decrease<br />
The short-term median value of Heavy Jets has continued to<br />
trend upwards since the end of Q3 2020.<br />
0%<br />
There have been a few ups and downs along the way, but median<br />
values have recovered 9% since mid-December through<br />
April. This trend has been driven in 2021 by a continued acceleration<br />
in transaction activity — up 19% in Q1 (March data incomplete)<br />
versus Q1 2020. The existing inventory has declined<br />
by 20% since a high in mid-2020, which has caused a scarcity in<br />
the Heavy Jets for sale.<br />
- 5%<br />
- 10%<br />
IMPORTANT NOTE: This chart represents aggregated data. The<br />
changes in values this year within individual make and model<br />
markets, and for specific serial numbers, may vary to a greater or<br />
lesser degree from these trends.<br />
- 15%<br />
- 20%<br />
Apr15<br />
May1<br />
May15<br />
Jun1<br />
Jun15<br />
Jul1<br />
Jul15<br />
Aug1<br />
Aug15<br />
Sep1<br />
Sep15<br />
Oct1<br />
Oct15<br />
Nov1<br />
Nov15<br />
Dec1<br />
Dec15<br />
Jan1<br />
Jan15<br />
Feb1<br />
Feb15<br />
Mar1<br />
Mar15<br />
Apr1<br />
Apr15<br />
Super-Mid Jet Short Term Median Value<br />
The short-term median value of Super-Mid Jets has steadily<br />
climbed 11% since the end of Q4 2020. Like the Heavy Jet market,<br />
this trend has been driven by a significant reduction in supply<br />
that results in 25% fewer Super-Mid Jets for sale today than in<br />
mid-2020. Resale retail transactions in Q1 2021 are even, with<br />
Q1 2020 year to date, but the March transaction data has not yet<br />
been fully documented. It appears that the likely year-over-year<br />
increase in Q1 transactions also contributed to the continued recovery<br />
in the short-term median values of Super-Mid Jets.<br />
IMPORTANT NOTE: This chart represents aggregated data. The<br />
changes in values this year within individual make and model<br />
markets, and for specific serial numbers, may vary to a greater or<br />
lesser degree from these trends.<br />
SUPER-MID JET SHORT TERM MEDIAN VALUE<br />
April 2020 – April 2021 % Value Change<br />
Increase<br />
5%<br />
0%<br />
- 5%<br />
- 10%<br />
- 15%<br />
Decrease<br />
- 20%<br />
Apr15<br />
May1<br />
May15<br />
Jun1<br />
Jun15<br />
Jul1<br />
Jul15<br />
Aug1<br />
Aug15<br />
Sep1<br />
Sep15<br />
Oct1<br />
Oct15<br />
Nov1<br />
Nov15<br />
Dec1<br />
Dec15<br />
Jan1<br />
Jan15<br />
Feb1<br />
Feb15<br />
Mar1<br />
Mar15<br />
Apr1<br />
Apr15<br />
44 | ASIAN SKY QUARTERLY — FIRST QUARTER 2021
AMSTAT GLOBAL PRE-OWNED MARKET UPDATE<br />
Medium Jets Short Term Median Value<br />
The short-term median value of Medium Jets has been recovering<br />
since December 2020 — up 8% through mid-April. This increase<br />
has also been driven in 2021 by continued robust resale transaction<br />
activity, up 20% (March data incomplete) in Q1 2021 over Q1 2020<br />
and a continued contraction in Medium Jet units for sale, down 25%<br />
since a mid-2020 high.<br />
IMPORTANT NOTE: This chart represents aggregated data. The<br />
changes in values this year within individual make and model markets,<br />
and for specific serial numbers, may vary to a greater or lesser<br />
degree from these trends.<br />
MEDIUM JET SHORT TERM MEDIAN VALUE<br />
April 2020 – April 2021 % Value Change<br />
Increase<br />
5%<br />
0%<br />
- 5%<br />
- 10%<br />
- 15%<br />
Decrease<br />
-20%<br />
Apr15<br />
May1<br />
May15<br />
Jun1<br />
Jun15<br />
Jul1<br />
Jul15<br />
Aug1<br />
Aug15<br />
Sep1<br />
Sep15<br />
Oct1<br />
Oct15<br />
Nov1<br />
Nov15<br />
Dec1<br />
Dec15<br />
Jan1<br />
Jan15<br />
Feb1<br />
Feb15<br />
Mar1<br />
Mar15<br />
Apr1<br />
Apr15<br />
Light Jet Short Term Median Value<br />
The short-term median value of Light jets has increased 11% since<br />
December 2020. As with other markets, this upward trend has continued<br />
into 2021, driven by increased resale transaction activity, up<br />
43% in Q1 versus Q1 2020, and a continued reduction in Light Jet<br />
inventory, down 29% since mid-2020.<br />
LIGHT JET SHORT TERM MEDIAN VALUE<br />
April 2020 – April 2021 % Value Change<br />
Increase<br />
5%<br />
0%<br />
Decrease<br />
IMPORTANT NOTE: This chart represents aggregated data. The<br />
changes in values this year within individual make and model markets,<br />
and for specific serial numbers, may vary to a greater or lesser<br />
degree from these trends.<br />
- 5%<br />
- 10%<br />
- 15%<br />
- 20%<br />
Apr15<br />
May1<br />
May15<br />
Jun1<br />
Jun15<br />
Jul1<br />
Jul15<br />
Aug1<br />
Aug15<br />
Sep1<br />
Sep15<br />
Oct1<br />
Oct15<br />
Nov1<br />
Nov15<br />
Dec1<br />
Dec15<br />
Jan1<br />
Jan15<br />
Feb1<br />
Feb15<br />
Mar1<br />
Mar15<br />
Apr1<br />
Apr15<br />
Turboprops Short Term Median Value<br />
TURBOPROP SHORT TERM MEDIAN VALUE<br />
April 2020 – April 2021 % Value Change<br />
Increase<br />
5%<br />
Decrease<br />
The short-term median value of Turboprops has oscillated since<br />
mid-2020 but has had an overall increase of 5% since November.<br />
As with other markets, this upward trend has continued into 2021.<br />
Turboprops have also been driven by strong resale transaction activity,<br />
up 25% in Q1 versus Q1 2020, and a continued tightening of<br />
inventory which is down by 21% since mid-2020.<br />
0%<br />
- 5%<br />
IMPORTANT NOTE: This chart represents aggregated data. The<br />
changes in values this year within individual make and model markets,<br />
and for specific serial numbers, may vary to a greater or lesser<br />
degree from these trends.<br />
- 10%<br />
- 15%<br />
- 20%<br />
Apr15<br />
May1<br />
May15<br />
Jun1<br />
Jun15<br />
Jul1<br />
Jul15<br />
Aug1<br />
Aug15<br />
Sep1<br />
Sep15<br />
Oct1<br />
Oct15<br />
Nov1<br />
Nov15<br />
Dec1<br />
Dec15<br />
Jan1<br />
Jan15<br />
Feb1<br />
Feb15<br />
Mar1<br />
Mar15<br />
Apr1<br />
Apr15<br />
FIRST QUARTER 2021 — ASIAN SKY QUARTERLY | 45
Q4 2020 - GLOBAL MARKET UPDATE<br />
— Commentary by Global Jet Capital<br />
The COVID-19 global pandemic presented business aviation with its biggest pressure test since the Great<br />
Recession, and to date the industry has demonstrated remarkable resilience. During the early stages of<br />
the pandemic, some worried that business aviation would face the same difficulties it did following the<br />
financial crisis: overproduction, swelling inventories, and broad-based aircraft devaluation. However, the industry<br />
developed a new level of production discipline, maturity, and stability over the past decade that has enabled it to<br />
remain healthy through this trying period. While transactions were down overall when comparing 2020 to 2019, Q4<br />
was the best quarter seen in at least three years, driven by strong pre-owned sales. Inventory levels as a percent<br />
of the total fleet are at the lowest levels ever seen, pointing to broad-based stability in aircraft values going into<br />
2021. Furthermore, charter, jet card, and fractional operators are reporting record 2020 performance driven to a<br />
large extent by new clients. While some of those new to the business aviation value proposition – random access,<br />
productivity, security, and health safety – may return to the airlines one day, we know from experience that many<br />
will remain in the industry, potentially moving into whole aircraft ownership.<br />
• Vaccine rollout and government stimulus are expected to drive<br />
economic growth in 2021.<br />
• In Q4 2020, business jet flight operations continued the gradual<br />
improvement seen in Q3. The nearly 987,000 flights recorded were 14<br />
percent below Q4 2019 levels. We expect this level of activity to continue<br />
until pandemic-related business and societal restrictions are lifted.<br />
• While backlogs at major business jet manufacturers declined yearover-year,<br />
OEMs indicate that increasing flight operations, low inventory<br />
levels, and new business jet models will drive demand for new business<br />
jets going forward.<br />
• Following a low in April and May, transaction activity gradually improved<br />
through the rest of the year, culminating in a very active Q4. In Q4, unit<br />
volume increased 6 percent year-over-year, while dollar volume increased<br />
2 percent. Pre-owned transactions, which proved easier than new<br />
production to restart, led the growth.<br />
• Increasing pre-owned transactions in H2 2020 led inventory levels<br />
to fall to 8 percent by December 2020, one of the lowest levels in<br />
recent memory.<br />
• While uncertainty remains, a few residual value trends have emerged.<br />
Some larger aircraft models have experienced value declines, while values<br />
of certain newer, small, and medium aircraft models have been more<br />
stable. With that said, the inventory of quality large and super-midsize<br />
aircraft is substantially depleted, and this is likely to drive stability and<br />
lead to improvement over 2021.<br />
The global outlook will be greatly influenced by the course of COVID-19.<br />
That being said, there is reason for cautious optimism within the business<br />
jet market due to the resiliency of the industry in 2020.<br />
46 | ASIAN SKY QUARTERLY — FIRST QUARTER 2021
COMMENTARY: GLOBAL JET CAPITAL<br />
GLOBAL ECONOMY<br />
Global GDP Percent Change<br />
15%<br />
10%<br />
5%<br />
0%<br />
- 5%<br />
- 10%<br />
Q1 2019 Q2 2019 Q3 2019 Q4 2019 Q1 2020 Q2 2020 Q3 2020 Q4 2020 Q1 2021 Q2 2021 Q3 2021 Q4 2021<br />
(Forecast) (Forecast) (Forecast) (Forecast)<br />
i<br />
Following sharp declines in 2020 due to the pandemic, the global<br />
economy is expected to rebound in 2021 as vaccines continue to<br />
be rolled out. Oxford Economics expects growth to peak in Q2 and<br />
remain strong through the rest of the year ii . An analysis by Managing<br />
Director and Head of Global Research for The Carlyle Group, Jason<br />
Thomas, demonstrates that economic damage caused by the pandemic<br />
mostly affected travel, tourism, live events, and other related<br />
industries. The downturn in those sectors was at least partially offset<br />
by growth in durable goods and digital services. Vaccine rollouts<br />
and government stimulus will drive growth in 2021 iii .<br />
FLIGHT OPERATIONS<br />
Global Business Jet Operations<br />
U.S.<br />
Rest of World<br />
1.14M<br />
1.11M<br />
1.15M<br />
1.13M<br />
15.1%<br />
16.3%<br />
16.0%<br />
14.5%<br />
1.15M<br />
14.7%<br />
1.00M<br />
16.4%<br />
0.94M<br />
12.1%<br />
0.99M<br />
13.3%<br />
0.57M<br />
10.2%<br />
84.9% 83.7% 84.0% 85.5%<br />
85.3% 83.6%<br />
89.8%<br />
87.9%<br />
86.7%<br />
Q4 2018 Q1 2019 Q2 2019 Q3 2019 Q4 2019 Q1 2020 Q2 2020 Q3 2020 Q4 2020<br />
iv<br />
The outbreak of COVID-19 disrupted global flight activity in the first<br />
half of 2020. According to the U.S. Federal Aviation Administration<br />
(FAA), business jet flight operations fell to an April low that was<br />
74.9 percent below the same period in 2019 before beginning a<br />
steady recovery in May. In Q3, operations were 16.6 percent below<br />
Q3 2019, a significant improvement from the 50.4 percent yearover-year<br />
decline recorded in Q2. Operations were 13.9 percent below<br />
Q4 2019 levels in Q4 2020 and appear to be following a similar<br />
trend in early 2021.<br />
Throughout the COVID-19 pandemic, business aviation has experienced<br />
increased demand from new customers looking to avoid<br />
potentially crowded commercial airports and flights. One study<br />
found that flying privately can reduce 680 “person-to-person”<br />
touchpoints compared to a commercial flight v . This shift in customer<br />
preferences has benefitted business aircraft operators. For<br />
example, Jet Aviation, a charter provider, has seen a large portion<br />
of its business come from customers new to business aviation. A<br />
recent study found that 96 percent of these new users will continue<br />
flying in business aircraft at least some of the time, even after<br />
the pandemic is over vii .<br />
FIRST QUARTER 2021 — ASIAN SKY QUARTERLY | 47
COMMENTARY: GLOBAL JET CAPITAL<br />
OEM BACKLOGS<br />
Q4 Backlog at Major Business Jet OEMs<br />
Bombardier Gulfstream Dassault Cessna Embraer<br />
USD Millions<br />
$30,569<br />
$33,303<br />
$27,369<br />
Q4 2018 Q4 2019 Q4 2020<br />
viii<br />
As major business jet manufacturers continued to deal with the<br />
COVID-19 pandemic, backlogs declined 17.8 percent year-over-year in<br />
Q4 2020. Much of the decline occurred early in 2020 and can be attributed<br />
to difficulty in closing deals, since potential customers could<br />
not meet with company representatives or inspect aircraft.<br />
As a group, manufacturers are optimistic about the future. Companies<br />
point to gradually increasing flight operations and low inventory levels<br />
as factors that will drive demand going forward. Many manufacturers<br />
also plan to introduce new aircraft or upgrade current aircraft over the<br />
next few years, further increasing the appeal of their products.<br />
Still, manufacturers remain conservative about production plans in 2021<br />
as they continue to balance supply and demand, keep workers safe, and<br />
restart supply chains. Guidance by individual OEMs ranges from slight<br />
declines in production, to steady production, to increases in production<br />
levels. The overall result will be steady production rates in 2021, with the<br />
potential for slight increases compared to 2020.<br />
TRANSACTIONS ($ VOLUME)<br />
Business Jet Transactions<br />
New<br />
Pre-Owned<br />
$8.8B<br />
$8.7B<br />
$8.9B<br />
(952 Units) $6.8B<br />
$6.9B (1,003 Units)<br />
(1,059 Units)<br />
$5.8B<br />
(760 Units) (738 Units)<br />
$5.1B<br />
$5.6B<br />
43.3% (629 Units)<br />
$4.8B<br />
39.2% (605 Units)<br />
(770 Units)<br />
48.4%<br />
40.4%<br />
38.9%<br />
(521 Units)<br />
43.1%<br />
46.0%<br />
35.7%<br />
50.8%<br />
56.7% 56.9% 59.6% 61.1%<br />
60.8% 54.0%<br />
64.3%<br />
49.2%<br />
51.6%<br />
Q4 2018 Q1 2019 Q2 2019 Q3 2019 Q4 2019 Q1 2020 Q2 2020 Q3 2020 Q4 2020<br />
60%<br />
YoY % Change in Transaction $ Volume<br />
40%<br />
20%<br />
0%<br />
-20%<br />
- 40%<br />
- 60%<br />
Q4 2018 Q1 2019 Q2 2019 Q3 2019 Q4 2019 Q1 2020 Q2 2020 Q3 2020 Q4 2020<br />
x<br />
Following a low in April and May, business jet transactions gradually volume was up 18 percent compared to Q2. Market improvement continued<br />
improved through the rest of 2020. Transaction unit volume was 4<br />
in Q4, with unit volume up 6 percent compared to Q4 2019 and<br />
percent higher in Q3 than the year prior. Transaction dollar volume dollar volume up 2 percent.<br />
was down 19 percent due to a changing mix of aircraft; however, dollar<br />
48 | ASIAN SKY QUARTERLY — FIRST QUARTER 2021
COMMENTARY: GLOBAL JET CAPITAL<br />
NEW DELIVERIES ($ VOLUME)<br />
PRE-OWNED TRANSACTIONS ($ VOLUME)<br />
2019 2020 2019 2020<br />
$9.5<br />
Billions<br />
$7.4<br />
$5.8<br />
$7.3<br />
Billions<br />
$5.2<br />
$4.1<br />
$6.1<br />
$7.1<br />
1st Half 2nd Half 1st Half 2nd Half<br />
xi<br />
While new deliveries remained low throughout 2020, increases in preowned<br />
transactions led to improvements in the second half of 2020.<br />
The decline in new volume was a result of a supply side shortage. Manufacturers<br />
reduced production to comply with social distancing policies<br />
earlier in the year and it took time to restart operations and resolve supply<br />
chain disruptions. Manufacturers were also proactive in managing<br />
supply to support aircraft values over the long term.<br />
On the other hand, pre-owned transactions have recovered faster. Transactions,<br />
measured in dollar volume, declined at similar rates for both<br />
new and pre-owned transactions in the first half of the year. However, in<br />
the second half of 2020, pre-owned transactions increased 17 percent<br />
compared to the second half of 2019. The second half improvement in<br />
the pre-owned market suggests a continued demand for aircraft and<br />
indicates that pre-owned transactions have been easier to restart than<br />
production of new aircraft.<br />
FOR SALE INVENTORY<br />
2,433<br />
YTD<br />
2,356<br />
Even as pre-owned transactions recovered in Q3 and Q4, aircraft listed<br />
for sale declined slightly compared to 2019. While there were monthly<br />
variations, owners listed 3.2 percent fewer aircraft through December<br />
2020 than during the same period in 2019. In 2020, the average number<br />
of aircraft listed for sale per week was 45. Compare that to new<br />
listings during the onset of the Great Recession in 2008, which averaged<br />
70 per week.<br />
2019 2020<br />
xiii<br />
PERCENT OF BUSINESS JET FLEET FOR SALE<br />
Total 0-12 Years 13+ Years<br />
15%<br />
10%<br />
5%<br />
Q4 2018<br />
Q1 2019 Q2 2019 Q3 2019 Q4 2019 Q1 2020 Q2 2020 Q3 2020 Q4 2020<br />
xiiv<br />
Increasing pre-owned transactions and declining aircraft listings led<br />
to stable business jet inventory levels in 2020. Inventory did increase<br />
through the first half of the year as COVID-19 made closing transactions<br />
difficult. The result was a peak inventory of 10.3 percent of the<br />
total fleet in June 2020 (still considered a healthy level). However, as<br />
pre-owned transactions increased in the second half of 2020, inventory<br />
levels fell, reaching 8.2 percent by December. Furthermore, inventory<br />
of aircraft younger than 13 years old, typically seen as more desirable,<br />
was 6.1 percent of the global fleet. Overall, the effect of COVID-19<br />
on preowned aircraft supply data has been minimal.<br />
FIRST QUARTER 2021 — ASIAN SKY QUARTERLY | 49
COMMENTARY: GLOBAL JET CAPITAL<br />
RESIDUAL VALUE<br />
YoY % Change in Values<br />
1.3%<br />
1.2%<br />
-0.3%<br />
-0.3%<br />
-4.1%<br />
-6.1%<br />
-6.5%<br />
-7.2%<br />
-3.1%<br />
-5.2%<br />
-13.2%<br />
-14.3%<br />
Q4 2009 Q4 2010 Q4 2011 Q4 2012 Q4 2013 Q4 2014 Q4 2015 Q4 2016 Q4 2017 Q4 2018 Q4 2019 Q4 2020<br />
xv<br />
The above chart compares the year-over-year percentage change<br />
in the bluebook value of like-aged aircraft over time (e.g., the difference<br />
between value of an eight-year-old aircraft from one year<br />
to the next). Global Jet Capital analyzes a basket of aircraft as a<br />
proxy for the overall market. Observed increases or decreases in<br />
value are not necessarily applicable to any specific aircraft make/<br />
model. For the value of a specific aircraft, please contact a licensed<br />
aircraft appraiser.<br />
Business jet bluebook values declined 5.2 percent in Q4 2020 after<br />
transaction markets were disrupted by COVID-19 earlier in the year.<br />
However, when compared to the 2008 financial crisis or to the disruptions<br />
to the business jet market in 2016 following the decline of<br />
commodity values, prices remain relatively stable. Lower transaction<br />
activity early in the pandemic in 2020, including some motivated sellers<br />
willing to take lower prices, may have had an outsized effect on<br />
the valuations of certain models.<br />
While the market continues to react to a dynamic global situation,<br />
initial conclusions on value trends can be drawn. Ultralong-range jets<br />
have declined in value, while the value of newer smaller and medium<br />
jets has been more stable. Buyers are reentering the market and inventory<br />
has trended downward, a factor that may lead to more stable<br />
prices moving forward. A number of factors, most importantly the<br />
pace of return to a more normal travel environment, will determine the<br />
trajectory of values in 2021.<br />
CONCLUSION<br />
Throughout 2020, the business jet industry remained healthier than many thought possible at<br />
the early stages of the pandemic, demonstrating a new level of production discipline, maturity,<br />
and stability. As a result, Q4 2020 was a strong quarter for the business jet market. Led by a<br />
recovery in pre-owned transactions, both unit and dollar volume in the quarter were at their<br />
highest levels in at least three years. Consequently, pre-owned aircraft inventories declined to<br />
near historic lows. In addition, flight operations continued their gradual improvement as newto-business-aviation<br />
customers continue to enter the market.<br />
Going forward, uncertainty will linger as the world continues to deal with the fallout from the<br />
COVID-19 pandemic and the race to vaccinate the population. Continued recovery will be tied to<br />
recovery from COVID-19.<br />
Notes:<br />
i. Oxford Economics<br />
ii. Oxford Economics<br />
iii. The Carlyle Group<br />
iv. U.S. FAA<br />
v. The Weekly of Business Aviation | Aviation Week Network<br />
vi. Jet Aviation | Jet Aviation Increases Charter Services<br />
vii. Private Jet Card Comparisons<br />
viii. Company financial reports<br />
50 | ASIAN SKY QUARTERLY — FIRST QUARTER 2021<br />
ix. Company financial reports and earnings calls<br />
x. JetNet and Global Jet Capital analysis. Units are in parentheses<br />
xi. JetNet and Global Jet Capital analysis<br />
xii. Company financial reports<br />
xiii. Amstat and Global Jet Capital Analysis<br />
xiv. JetNet and Global Jet Capital Analysis<br />
xv. Aircraft Bluebook and Global Jet Capital analysis
FIRST QUARTER 2021 — ASIAN SKY QUARTERLY | 51
MARKET DYNAMICS<br />
PRE-OWNED BUSINESS JET MARKET Q1 2021<br />
Understanding the market dynamics graphs:<br />
The Inventory Value Line represents the number of aircraft actively being marketed for sale in USD terms. 2<br />
The Signal Line represents an indication of where the market’s direction may be heading in the future.<br />
INVENTORY VALUE (USD) 1<br />
WORLDWIDE<br />
$7,626M<br />
$5,772M<br />
ASIA PACIFIC<br />
$1,198M<br />
$670M<br />
MARKET TREND 1 WORLDWIDE<br />
TREND WORSENING<br />
TREND REVERSAL<br />
TREND REVERSAL<br />
MOVING TOWARDS SELLER’S MARKET<br />
TREND IMPROVEMENT<br />
MOVING TOWARDS BUYER’S MARKET<br />
AIRCRAFT TRANSACTIONS 1 WORLDWIDE<br />
107<br />
81<br />
53<br />
70<br />
56 54 60 46 50 51 52<br />
64<br />
34 34<br />
41<br />
35<br />
46<br />
68<br />
44<br />
51<br />
47<br />
63<br />
43<br />
39 41 36<br />
39<br />
43<br />
53<br />
42 39<br />
71<br />
39 39 39<br />
39<br />
22<br />
Mar Apr May Jun Jul Aug Sep Oct Nov Dec Jan Feb Mar Apr May Jun Jul Aug Sep Oct Nov Dec Jan Feb Mar Apr May Jun Jul Aug Sep Oct Nov Dec Jan Feb Mar<br />
2018<br />
2019<br />
2020<br />
2021<br />
1 The historical inventory value and transactions are subject to change based on latest market information updates.<br />
2 ASG’s Inventory Value line is calculated by taking the total number of aircraft for sale from a selection of 39 different models, multiplied by their average asking prices.<br />
52 | ASIAN SKY QUARTERLY — FIRST QUARTER 2021
MARKET DYNAMICS<br />
WORLDWIDE % OF FLEET SOLD<br />
1.40%<br />
1.20%<br />
1.00%<br />
0.80%<br />
0.60%<br />
0.40%<br />
0.20%<br />
Mar<br />
2018<br />
May Jul Sep Nov Jan Mar May Jul Sep Nov Jan Mar May Jul Sep Nov Jan<br />
2019<br />
2020<br />
2021<br />
Mar<br />
AVERAGE ASKING PRICE<br />
MILLION USD<br />
28<br />
26<br />
24<br />
ASIA PACIFIC<br />
22<br />
20<br />
18<br />
16<br />
14<br />
12<br />
WORLDWIDE<br />
10<br />
Mar<br />
2018<br />
May Jul Sep Nov Jan Mar May Jul Sep Nov Jan Mar May Jul Sep Nov Jan<br />
2019<br />
2020<br />
2021<br />
Mar<br />
% OF FLEET FOR SALE<br />
10%<br />
9%<br />
ASIA PACIFIC<br />
8%<br />
7%<br />
6%<br />
WORLDWIDE<br />
5%<br />
4%<br />
3%<br />
AVERAGE DAYS ON MARKET<br />
550<br />
Mar<br />
2018<br />
May Jul Sep Nov Jan Mar May Jul Sep Nov Jan Mar May Jul Sep Nov Jan<br />
2019<br />
2020<br />
2021<br />
Mar<br />
500<br />
450<br />
ASIA PACIFIC<br />
400<br />
350<br />
300<br />
WORLDWIDE<br />
250<br />
200<br />
Mar<br />
2018<br />
May Jul Sep Nov Jan Mar May Jul Sep Nov Jan Mar May Jul Sep Nov Jan<br />
2019<br />
2020<br />
2021<br />
Mar<br />
FIRST QUARTER 2021 — ASIAN SKY QUARTERLY | 53
MARKET DYNAMICS<br />
SUPPLY / DEMAND INDICATORS<br />
BUSINESS JETS<br />
SUPPLY VS. DEMAND RATIO<br />
AVERAGE DAYS ON MARKET<br />
SUPPLY<br />
><br />
DEMAND<br />
% OF FLEET<br />
FOR SALE<br />
MODEL<br />
DAYS ON MARKET<br />
AVERAGE<br />
NO TRANSACTIONS<br />
NO TRANSACTIONS<br />
NO TRANSACTIONS<br />
NO TRANSACTIONS<br />
NO TRANSACTIONS<br />
450% 400% 350% 300% 250% 200% 150% 100% 50% 0<br />
Average AC for sale / Total sold in last 12 months<br />
5.3%<br />
4.2%<br />
5.6%<br />
6.0%<br />
4.5%<br />
4.4%<br />
1.4%<br />
7.1%<br />
6.9%<br />
2.7%<br />
10.1%<br />
9.2%<br />
11.8%<br />
6.5%<br />
6.8%<br />
3.9%<br />
3.3%<br />
2.3%<br />
5.4%<br />
3.8%<br />
6.6%<br />
2.3%<br />
5.0%<br />
10.0%<br />
5.7%<br />
6.5%<br />
ACJ318<br />
ACJ319<br />
ACJ320<br />
BBJ<br />
BBJ2<br />
CL300<br />
CL350<br />
CL604<br />
CL605<br />
CL650<br />
CL850<br />
GL Express<br />
GL XRS<br />
GL5000<br />
GL6000<br />
CIT. CJ3<br />
CIT. CJ4<br />
CIT. Latitude<br />
CIT. Sovereign<br />
F2000LX<br />
F2000LXS<br />
F2000S<br />
5.8% F7X<br />
5.8%<br />
4.2%<br />
F8X<br />
F900DX<br />
6.8% F900EX<br />
4.2%<br />
4.8%<br />
7.9%<br />
5.8%<br />
9.6%<br />
1.8%<br />
5.0%<br />
2.7%<br />
2.8%<br />
5.3%<br />
Average<br />
F900EXe<br />
F900LX<br />
L1000<br />
L600<br />
L650<br />
Phenom 300<br />
G200<br />
G280<br />
G450<br />
G500<br />
G550<br />
G650<br />
G650ER<br />
AVERAGE<br />
0 200 400 600 800 1000<br />
The above chart reflects where certain aircraft models are positioned<br />
in terms of supply and demand (based on a ratio of completed<br />
transactions compared to the number of sellers and the average<br />
number of days on the market for a transaction to take place).<br />
These indications do not necessarily mean that prices will be higher<br />
in the future, but it does indicate that sellers of these particular<br />
models are more likely to find willing buyers in a shorter period of<br />
time than the overall average.<br />
For some model types, given the market indicators shown on the<br />
previous page, the stabilization in pre-owned asking prices and<br />
decline in inventory level appear to have stimulated increased<br />
demand, leading to an increase in transactions and a more balanced<br />
state of supply and demand.<br />
This can be seen most with certain Gulfstream aircraft (G200, G450,<br />
G550, G650), Bombardier models (Challenger 604/605 & Global<br />
5000) and Dassault Falcon models (2000 Series and 7X), where<br />
more transactions are occurring relative to the number for sale, and<br />
transactions are requiring less time on the market for sellers to complete.<br />
54 | ASIAN SKY QUARTERLY — FIRST QUARTER 2021
MARKET DYNAMICS<br />
MARKET POSITIONING<br />
BUSINESS JETS<br />
ACJ318<br />
ACJ319<br />
ACJ320<br />
BBJ 1<br />
BBJ 2<br />
CL300<br />
CL350<br />
CL604<br />
CL605<br />
CL650<br />
CL850<br />
GL Express<br />
GL XRS<br />
GL5000<br />
GL6000<br />
CIT. CJ3<br />
CIT. CJ4<br />
CIT. Latitude<br />
CIT. Sovereign<br />
F2000LX<br />
F2000LXS<br />
F2000S<br />
F7X<br />
F8X<br />
F900DX<br />
F900EX<br />
F900EXe<br />
F900LX<br />
L1000<br />
L600<br />
L650<br />
Phenom 300<br />
G200<br />
G280<br />
G450<br />
G500<br />
G550<br />
G650<br />
G650ER<br />
MOVING TOWARDS<br />
BUYER’S MARKET<br />
Balanced<br />
Supply & Demand<br />
MOVING TOWARDS<br />
SELLER’S MARKET<br />
The above chart provides a visual representation of the Supply /<br />
Demand Ratio of each aircraft model relative to the overall market,<br />
and is based on a ‘Marketability’ calculation for each particular model<br />
including the following four market indicators:<br />
When taking into account these four factors, most of the the large and<br />
medium sized jets, such as Challenger 600, Falcon 2000 & 900 Series,<br />
as well as the various Gulfstream models, appear better positioned to<br />
find buyers available, compared to corporate airliner models.<br />
1. The percentage of aircraft for sale relative to its fleet size.<br />
2. The number of aircraft sold relative to the average number for sale.<br />
3. The average days for sale relative to the overall market average.<br />
4. The momentum of the marketplace (represented by the trend<br />
towards supply and demand market equilibrium portrayed earlier).<br />
* Since 2019 Q3, ASG expanded its market research scope to include<br />
39 business jet models including light jet models as described in the<br />
report.<br />
FIRST QUARTER 2021 — ASIAN SKY QUARTERLY | 55
MARKET DYNAMICS<br />
PRE-OWNED HELICOPTERS MARKET Q1 2021<br />
Understanding the market dynamics grpahs:<br />
The Inventory Value Line represents the number of aircraft actively being marketed for sale in USD terms. 2<br />
The Signal Line represents an indication of where the market’s direction may be heading in the future.<br />
INVENTORY VALUE (USD) 1<br />
$1,378M<br />
WORLDWIDE<br />
$184M<br />
ASIA PACIFIC<br />
$1,103M<br />
MARKET TREND 1 WORLDWIDE<br />
$135M<br />
TREND WORSENING<br />
TREND WORSENING<br />
TREND IMPROVEMENT<br />
SELLER’S MARKET<br />
TREND IMPROVEMENT<br />
AIRCRAFT TRANSACTIONS 1 WORLDWIDE<br />
40<br />
44<br />
31<br />
36 35 35<br />
33 34 32<br />
24 24<br />
23 23 22<br />
18<br />
35<br />
27 28 16<br />
22<br />
16<br />
24<br />
33<br />
26<br />
30<br />
24<br />
28<br />
19<br />
27<br />
28<br />
20 21 21<br />
34<br />
27<br />
21<br />
18<br />
Mar Apr May Jun Jul Aug Sep Oct Nov Dec Jan Feb Mar Apr May Jun Jul Aug Sep Oct Nov Dec Jan Feb Mar Apr May Jun Jul Aug Sep Oct Nov Dec Jan Feb Mar<br />
2018<br />
2019<br />
2020<br />
2021<br />
1 The historical inventory value and transactions are subject to change based on latest market information updates.<br />
2 ASG’s Inventory Value line is calculated by taking the total number of aircraft for sale from a selection of 39 different models, multiplied by their average asking prices.<br />
56 | ASIAN SKY QUARTERLY — FIRST QUARTER 2021
MARKET DYNAMICS<br />
% OF AC SOLD / TOTAL AC IN OPERATION<br />
0.45%<br />
0.35%<br />
0.30%<br />
0.25%<br />
0.20%<br />
0.15%<br />
0.10%<br />
0.05%<br />
0.00%<br />
Mar<br />
2018<br />
May Jul Sep Nov Jan Mar May Jul Sep Nov Jan Mar May Jul Sep Nov Jan<br />
2019<br />
2020<br />
2021<br />
Mar<br />
AVERAGE ASKING PRICE<br />
MILLION USD<br />
3.4<br />
3.2<br />
ASIA PACIFIC<br />
3.0<br />
2.8<br />
2.6<br />
WORLDWIDE<br />
2.4<br />
2.2<br />
2.0<br />
Mar<br />
2018<br />
May Jul Sep Nov Jan Mar May Jul Sep Nov Jan Mar May Jul Sep Nov Jan<br />
2019<br />
2020<br />
2021<br />
Mar<br />
% OF AC FOR SALE<br />
5.0%<br />
WORLDWIDE<br />
4.5%<br />
4.0%<br />
3.5%<br />
ASIA PACIFIC<br />
3.0%<br />
2.5%<br />
2.0%<br />
1.5%<br />
AVERAGE DAYS ON MARKET<br />
650<br />
Mar<br />
2018<br />
May Jul Sep Nov Jan Mar May Jul Sep Nov Jan Mar May Jul Sep Nov Jan<br />
2019<br />
2020<br />
2021<br />
WORLDWIDE<br />
Mar<br />
600<br />
550<br />
ASIA PACIFIC<br />
500<br />
450<br />
400<br />
350<br />
Mar<br />
2018<br />
May Jul Sep Nov Jan Mar May Jul Sep Nov Jan Mar May Jul Sep Nov Jan<br />
2019<br />
2020<br />
2021<br />
Mar<br />
FIRST QUARTER 2021 — ASIAN SKY QUARTERLY | 57
MARKET DYNAMICS<br />
MARKET POSITIONING<br />
HELICOPTERS<br />
SUPPLY VS. DEMAND RATIO<br />
SUPPLY / DEMAND INDICATORS<br />
SUPPLY<br />
> DEMAND<br />
DAYS ON MARKET<br />
AVERAGE<br />
% FOR SALE MODEL<br />
1.0%<br />
EC145<br />
AVERAGE<br />
4.3%<br />
H125<br />
3.0%<br />
H130<br />
0.8%<br />
H145<br />
NO TRANSACTIONS<br />
6.5%<br />
H155<br />
5.0%<br />
EC135P2<br />
0.7%<br />
EC135T2<br />
2.4%<br />
EC1558<br />
5.3%<br />
BELL<br />
206JETRANGER<br />
5.1%<br />
BELL<br />
206LONGRANGER<br />
4.2%<br />
BELL 407<br />
4.7%<br />
BELL 412EP<br />
4.3%<br />
BELL 412HP<br />
2.3%<br />
BELL 429<br />
7.1%<br />
AW109SP GN<br />
3.2%<br />
AW139<br />
12.4%<br />
S76C+<br />
350% 300% 250% 200% 150% 100% 50% 0<br />
Average AC for sale / Total sold in last 12 months<br />
4.33%<br />
Average<br />
0 100 200 300 400 500<br />
Average Days for Sale on Market<br />
600 700 800<br />
The above chart reflects where certain aircraft models are positioned in terms of supply and demand (based on a ration of completed<br />
transactions compared to the number of sellers, and average number of days on the market for a transaction to take place).<br />
58 | ASIAN SKY QUARTERLY — FIRST QUARTER 2021
MARKET DYNAMICS<br />
MARKET POSITIONING<br />
HELICOPTERS<br />
MOVING TOWARDS<br />
BUYER’S MARKET<br />
Balanced<br />
Supply & Demand<br />
MOVING TOWARDS<br />
SELLER’S MARKET<br />
EC145<br />
H125<br />
H130<br />
H145<br />
H155<br />
EC135P2<br />
EC135T2<br />
EC1558<br />
BELL 206JETRANGER<br />
BELL 206LONGRANGER<br />
BELL 407<br />
BELL 412EP<br />
BELL 412HP<br />
BELL 429<br />
AW109SP GN<br />
AW139<br />
S76C+<br />
The above chart provides a visual representation of the Supply / Demand Ratio of each aircraft model relative to the overall market, resulting in a<br />
‘Marketability’ calculation of each particular model based on the following four market indicators:<br />
1. The percentage of aircraft for sale relative to its fleet size.<br />
2. The number of aircraft sold relative to the average number for sale.<br />
3. The average days for sale relative to the overall market average.<br />
4. The momentum of the marketplace (represented by the trend towards supply and demand market equilibrium portrayed earlier).<br />
FIRST QUARTER 2021 — ASIAN SKY QUARTERLY | 59
MARKET SUMMARY<br />
AIRCRAFT POSITIONING - BUSINESS JET<br />
AIRCRAFT ACQUISITION VS. MAX RANGE<br />
CORP. AIRLINER<br />
LONG RANGE<br />
LARGE<br />
MEDIUM<br />
LIGHT<br />
VERY LIGHT<br />
ACJ321<br />
ACJ320<br />
BBJ3<br />
BBJ2<br />
24<br />
23<br />
22<br />
21<br />
20<br />
19<br />
18<br />
17<br />
16<br />
15<br />
14<br />
ACJ319 BBJ<br />
G650ER<br />
ACJ318<br />
G650<br />
GLOBAL 6000<br />
G550<br />
LINEAGE 1000E<br />
F8X<br />
GLOBAL 5000<br />
F7X<br />
G500<br />
F900LX<br />
13<br />
12<br />
11<br />
10<br />
9<br />
8<br />
CIT. XLS+<br />
LEGACY 500<br />
LEGACY 650<br />
LEGACY 600<br />
CIT. X+<br />
CIT. SOVEREIGN+ F2000DX<br />
CIT. LATITUDE<br />
L75<br />
CL850<br />
LEGACY 450<br />
CIT. SOVEREIGN<br />
H850XP<br />
CIT. X<br />
H4000<br />
CL350<br />
CL650<br />
G350<br />
CL300 G300<br />
F2000<br />
G150<br />
H900XP<br />
CL605<br />
F50EX<br />
G200<br />
GLOBAL EXPRESS XRS<br />
F2000LXS<br />
G450<br />
F2000S<br />
GLOBAL EXPRESS<br />
G280<br />
F900EX EASY<br />
F2000LX<br />
G-IVSP<br />
G-IV F900EX<br />
F2000EX<br />
CL604<br />
G-V<br />
7<br />
6<br />
5<br />
4<br />
3<br />
TOTAL ANNUAL COST (MILLION USD/YEAR)<br />
CIT. CJ4 L70<br />
H800XP<br />
CIT. VII<br />
PHENOM 300<br />
L45XR<br />
L60XR<br />
CIT. CJ3+ CIT. XLS<br />
CIT. EXCEL<br />
L40XR<br />
G100<br />
CIT. CJ2+ CIT. CJ3<br />
CIT. ENCORE+<br />
ASTRA SP<br />
CIT. M2 DIAMOND 1A<br />
CIT. ENCORE<br />
H800 CIT. ULTRA<br />
CIT. BRAVO<br />
CIT. CJ2<br />
NEXTANT 400XTI<br />
H400XP<br />
CIT. CJ1<br />
CIT. CJ1+<br />
BEECHJET 400<br />
PREMIER 1A<br />
HONDAJET<br />
PHENOM 100E<br />
CIT. MUSTANG<br />
2<br />
ECLIPSE 550<br />
1<br />
500<br />
1,000<br />
1,500<br />
2,000<br />
2,500<br />
3,000<br />
3,500<br />
4,000<br />
4,500<br />
5,000<br />
5,500<br />
6,000<br />
6,500<br />
7,000<br />
7,500<br />
8,000<br />
MAX RANGE (N.M.)<br />
* The estimated total yearly cost is based on aircraft ownership cost for 10 years including financing, plus annual operating costs and regional adjustments.<br />
Source: Conklin & de Decker<br />
60 | ASIAN SKY QUARTERLY — FIRST QUARTER 2021
MARKET SUMMARY PER MODEL — BUSINESS JETS<br />
INVENTORY LEVEL, PRICE TREND & TRANSACTIONS<br />
ACJ318, ACJ319 & ACJ320<br />
PERFORMANCE<br />
Max Range<br />
Max Speed<br />
Typ. Passengers<br />
ACJ318<br />
4,253 N.M. /7,877 km<br />
Mach 0.82<br />
19<br />
ACJ319<br />
6,000 N.M. /11,112 km<br />
Mach 0.82<br />
19<br />
ACJ320<br />
5,250 N.M. /9,723 km<br />
Mach 0.82<br />
19<br />
SUPPLY<br />
No. for Sale<br />
Avg Asking Price<br />
Avg Days on Market<br />
TRANSACTION<br />
Past 12 Months<br />
Past 3 Months<br />
2021 Mar 2020 Dec 2021 Mar 2020 Dec 2021 Mar 2020 Dec<br />
1 (5.3%) 3 (15.8%) 3 (4.2%) 3 (4.2%) 1 (5.6%) 1 (5.6%)<br />
25.0M USD 23.0M USD 42.0M USD 42.0M USD 39.5M USD 39.5M USD<br />
613 1,210 1,112 1,022 931 841<br />
2021 Mar 2020 Dec 2021 Mar 2020 Dec 2021 Mar 2020 Dec<br />
2<br />
1<br />
1<br />
1<br />
1<br />
0<br />
1<br />
0<br />
0<br />
0<br />
0<br />
0<br />
$23.7<br />
Sold<br />
1<br />
Average Asking Price<br />
$46.9<br />
$45.2 $45.5<br />
$39.5<br />
$39.5<br />
$23.2<br />
For Sale vs. Sold<br />
For Sale<br />
1<br />
1<br />
$39.5<br />
$26.0<br />
ACJ318<br />
ACJ319<br />
ACJ320<br />
Average<br />
$43.0 $42.0 $42.0 $42.0<br />
$39.5<br />
$39.5<br />
$39.5 $39.5<br />
$25.2 $25.2<br />
$23.0<br />
$25.0<br />
1<br />
1 1<br />
Market Indicators (vs. Last Quarter)<br />
ACJ318<br />
Transaction Level (Past 12 Months)<br />
Inventory Level<br />
Average Asking Price<br />
Average Days on Market<br />
ACJ319<br />
Transaction Level (Past 12 Months)<br />
Inventory Level<br />
Average Asking Price<br />
Average Days on Market<br />
ACJ320<br />
Transaction Level (Past 12 Months)<br />
Inventory Level<br />
11 10 10 10 11 11 10 9 9 8 8 8 8 8 7 7 7 7 7 6 7 7 7 5 5<br />
Average Asking Price<br />
Average Days on Market<br />
Mar May Jul Sep Nov Jan Mar May Jul Sep Nov Jan Mar<br />
2019 2020 2021<br />
Source: AMSTAT & ASG<br />
FIRST QUARTER 2021 — ASIAN SKY QUARTERLY | 61
MARKET SUMMARY<br />
BBJ & BBJ2<br />
PERFORMANCE<br />
Max Range<br />
Max Speed<br />
Typ. Passengers<br />
BBJ<br />
6,235 N.M. / 11,547 km<br />
Mach 0.82<br />
19<br />
BBJ2<br />
5,620 N.M. / 10,408 km<br />
Mach 0.82<br />
19<br />
SUPPLY<br />
No. for Sale<br />
Avg Asking Price<br />
Avg Days on Market<br />
2021 Mar 2020 Dec 2021 Mar 2020 Dec<br />
8 (6.0%) 7 (5.3%) 1 (4.5%) 1 (4.5%)<br />
28.5M USD 22.3M USD 90.0M USD 90.0M USD<br />
372 325<br />
314 224<br />
TRANSACTION<br />
Past 12 Months<br />
Past 3 Months<br />
2021 Mar 2020 Dec 2021 Mar 2020 Dec<br />
4<br />
4<br />
1<br />
1<br />
0<br />
0<br />
0<br />
0<br />
Average Asking Price<br />
BBJ2<br />
BBJ<br />
Average<br />
$90.0 $90.0 $90.0 $90.0 $90.0 $90.0 $90.0<br />
Market Indicators (vs. Last Quarter)<br />
BBJ<br />
Transaction Level (Past 12 Months)<br />
Inventory Level<br />
Average Asking Price<br />
Average Days on Market<br />
BBJ2<br />
$47.2 $43.8<br />
$48.0<br />
Transaction Level (Past 12 Months)<br />
Inventory Level<br />
For Sale vs. Sold<br />
$28.3<br />
$20.9 $22.3<br />
$28.5<br />
Average Asking Price<br />
Average Days on Market<br />
Sold<br />
For Sale<br />
3<br />
1<br />
1<br />
1<br />
1<br />
1<br />
1<br />
2<br />
1<br />
11 12 12 13 11 10 9 9 7 7 11 11 12 9 10 7 7 7 7 7 7 8 9 9 9<br />
Mar May Jul Sep Nov Jan Mar May Jul Sep Nov Jan Mar<br />
2019 2020 2021<br />
Source: AMSTAT & ASG<br />
FEATURED AIRCRAFT<br />
BBJ SN37111<br />
TOTAL HOURS: 3,187 SINCE NEW<br />
TOTAL CYCLES: 947 SINCE NEW<br />
• High Quality Alberto Pinto Design Interior<br />
• 18 Passenger Seats Certified for Takeoff, Taxi and Landing<br />
• Interior Completed by Associated Air Center in 2010<br />
• Engine Enrolled on GE OnPoint Program (Full Warranty)<br />
• 7 Auxiliary Fuel Tank System<br />
• Lower Cabin Alt Modification<br />
• Full Internet and wireless Lan System throughout the Cabin<br />
62 | ASIAN SKY QUARTERLY — FIRST QUARTER 2021
MARKET SUMMARY<br />
CHALLENGER 300 & 350<br />
PERFORMANCE<br />
Max Range<br />
Max Speed<br />
Typ. Passengers<br />
CL300<br />
3,340 N.M. /6,185 km<br />
Mach 0.82<br />
19<br />
CL350<br />
3,421 N.M. /6,335 km<br />
Mach 0.82<br />
19<br />
SUPPLY<br />
No. for Sale<br />
Avg Asking Price<br />
Avg Days on Market<br />
2021 Mar 2020 Dec 2021 Mar 2020 Dec<br />
20 (4.4%) 25 (5.5%) 5 (1.4%) 4 (1.1%)<br />
8.1M USD 9.2M USD 15.7M USD 15.6M USD<br />
206 256<br />
84 114<br />
TRANSACTION<br />
Past 12 Months<br />
Past 3 Months<br />
2021 Mar 2020 Dec 2021 Mar 2020 Dec<br />
31 24<br />
14 12<br />
7<br />
10<br />
2<br />
6<br />
Average Asking Price<br />
CL350<br />
Market Indicators (vs. Last Quarter)<br />
$16.0<br />
$15.3<br />
$16.1<br />
$14.9<br />
$14.4<br />
CL300<br />
Average<br />
$17.0<br />
$15.7<br />
CL300<br />
Transaction Level (Past 12 Months)<br />
Inventory Level<br />
Average Asking Price<br />
Average Days on Market<br />
$10.3<br />
$9.2<br />
$9.8<br />
$8.0<br />
$7.4<br />
$8.0 $8.1<br />
CL350<br />
Transaction Level (Past 12 Months)<br />
Inventory Level<br />
Average Asking Price<br />
For Sale vs. Sold<br />
Average Days on Market<br />
1<br />
Sold<br />
4<br />
For Sale<br />
2 5 5<br />
2 2<br />
3<br />
1<br />
1<br />
11<br />
1<br />
1<br />
5<br />
1 2<br />
6<br />
5<br />
1 4 7<br />
5<br />
1<br />
3<br />
5<br />
23 28 36 37 36 35 37 35 36 38 35 33 34 42 40 40 38 36 35 31 31 29 25 27 25<br />
Mar May Jul Sep Nov Jan Mar May Jul Sep Nov Jan Mar<br />
2019 2020 2021<br />
Source: AMSTAT & ASG<br />
FIRST QUARTER 2021 — ASIAN SKY QUARTERLY | 63
MARKET SUMMARY<br />
CHALLENGER 604, 605 & 650<br />
PERFORMANCE<br />
Max Range<br />
Max Speed<br />
Typ. Passengers<br />
CL604<br />
4,027 N.M. / 7,458 km<br />
Mach 0.82<br />
9<br />
CL605<br />
4,123 N.M. / 7,635 km<br />
Mach 0.82<br />
9<br />
CL650<br />
4,123 N.M. / 7,635 km<br />
Mach 0.82<br />
10<br />
SUPPLY<br />
No. for Sale<br />
Avg Asking Price<br />
Avg Days on Market<br />
2021 Mar 2020 Dec 2021 Mar 2020 Dec 2021 Mar 2020 Dec<br />
25 (7.1%) 26 (7.3%) 20 (6.9%) 29 (10.1%) 3 (2.7%) 4 (3.7%)<br />
4.6M USD 4.1M USD 8.1M USD 8.8M USD 16.5M USD 16.5M USD<br />
218 292<br />
269 240<br />
96 200<br />
TRANSACTION<br />
Past 12 Months<br />
Past 3 Months<br />
2021 Mar 2020 Dec 2021 Mar 2020 Dec 2021 Mar 2020 Dec<br />
31 25<br />
34 25<br />
5<br />
4<br />
6<br />
13<br />
9<br />
16<br />
1<br />
2<br />
$18.7<br />
Average Asking Price<br />
$18.2<br />
CL650<br />
CL605<br />
CL604<br />
Average<br />
$17.5<br />
$17.0 $16.7<br />
$17.0 $16.5<br />
Market Indicators (vs. Last Quarter)<br />
CL604<br />
Transaction Level (Past 12 Months)<br />
Inventory Level<br />
Average Asking Price<br />
$12.2<br />
$11.9 $11.5<br />
$10.2 $9.9<br />
$8.7<br />
$8.1<br />
Average Days on Market<br />
CL605<br />
Transaction Level (Past 12 Months)<br />
$4.8<br />
$4.8<br />
$4.8<br />
$4.8 $4.6 $4.6 $4.6<br />
Inventory Level<br />
Average Asking Price<br />
For Sale vs. Sold<br />
Average Days on Market<br />
Sold For Sale<br />
9 6<br />
6 1<br />
4<br />
2<br />
5<br />
7 7 3<br />
6<br />
8<br />
4<br />
4<br />
5<br />
2 4 2<br />
6<br />
7<br />
13<br />
11<br />
3<br />
4<br />
9<br />
CL650<br />
Transaction Level (Past 12 Months)<br />
Inventory Level<br />
Average Asking Price<br />
34 37 43 49 50 49 46 46 46 48 50 52 56 62 65 67 67 66 75 72 69 59 55 53 48<br />
Average Days on Market<br />
Mar May Jul Sep Nov Jan Mar May Jul Sep Nov Jan Mar<br />
2019 2020 2021<br />
Source: AMSTAT & ASG<br />
FEATURED AIRCRAFT<br />
CHALLENGER 650 SN 6131<br />
TOTAL HOURS: 734 SINCE NEW<br />
TOTAL CYCLES: 332 SINCE NEW<br />
• Always Hangared<br />
• Mint Condition with Very Low Hours Since New<br />
• 11 Passengers & Belted Lav Configuration with Fwd Galley<br />
• Original OEM Warranty: 5 Years Airframe & 2 Years Interior<br />
• 2020 Avionics Ready: FANS 1A+, ADS-B Out, CPDLC & TCAS II 7.1<br />
• Satellite Communication System<br />
• ELT, CVR & FDR<br />
• Eligible for Engine & APU Program Enrollment<br />
64 | ASIAN SKY QUARTERLY — FIRST QUARTER 2021
MARKET SUMMARY<br />
CHALLENGER 850<br />
Average Asking Price<br />
Market Indicators (vs. Last Quarter)<br />
$9.3<br />
$9.5<br />
Transaction Level (Past 12 Months)<br />
$7.0<br />
$8.0<br />
$6.8<br />
Inventory Level<br />
Average Asking Price<br />
Average Days on Market<br />
$4.6<br />
$5.0<br />
PERFORMANCE<br />
Max Range<br />
Max Speed<br />
6,750 N.M. / 12,501 km<br />
Mach 0.87<br />
For Sale vs. Sold<br />
Typ. Passengers<br />
18<br />
Sold<br />
For Sale<br />
2<br />
1<br />
1 1<br />
1<br />
1<br />
1<br />
1<br />
2<br />
1<br />
1<br />
SUPPLY<br />
No. for Sale<br />
Avg Asking Price<br />
Avg Days on Market<br />
2021 Mar 2020 Dec<br />
9 (10.1%) 12 (13.3%)<br />
5.0M USD 4.6M USD<br />
709 538<br />
8 8 9 9 9 9<br />
8<br />
9 10 10 11 10 11 12 13 14 14 15 15<br />
12 13 12 11 9 9<br />
TRANSACTION<br />
Past 12 Months<br />
Past 3 Months<br />
2021 Mar 2020 Dec<br />
7 6<br />
1 1<br />
Mar May Jul Sep Nov Jan Mar May Jul Sep Nov Jan Mar<br />
2019 2020 2021<br />
Source: AMSTAT & ASG<br />
FIRST QUARTER 2021 — ASIAN SKY QUARTERLY | 65
MARKET SUMMARY<br />
GLOBAL EXPRESS, 5000, XRS & 6000<br />
PERFORMANCE<br />
Max Range<br />
Max Speed<br />
Typ. Passengers<br />
GLOBAL 5000<br />
5,350 N.M. / 9,908 km<br />
Mach 0.82<br />
13<br />
GLOBAL EXPRESS<br />
6,125 N.M. / 11,343 km<br />
Mach 0.82<br />
13<br />
GLOBAL XRS<br />
6,226 N.M. / 11,520 km<br />
Mach 0.82<br />
13<br />
GLOBAL 6000<br />
6,080 N.M. / 11,260 km<br />
Mach 0.82<br />
13<br />
SUPPLY<br />
No. for Sale<br />
Avg Asking Price<br />
Avg Days on Market<br />
2021 Mar 2020 Dec 2021 Mar 2020 Dec 2021 Mar 2020 Dec 2021 Mar 2020 Dec<br />
15 (6.5%) 17 (7.3%) 13 (9.2%) 19 (13.4%) 19 (11.8%) 21 (13.0%) 22 (6.8%) 23 (7.1%)<br />
15.0M USD 13.6M USD 8.0M USD 7.5M USD 14.9M USD 14.7M USD 26.0M USD 27.1M USD<br />
289 379<br />
534 374<br />
303 234<br />
230 210<br />
TRANSACTION<br />
Past 12 Months<br />
Past 3 Months<br />
2021 Mar 2020 Dec 2021 Mar 2020 Dec 2021 Mar 2020 Dec 2021 Mar 2020 Dec<br />
25 18<br />
17 15<br />
12 10<br />
26 17<br />
7<br />
7<br />
2<br />
7<br />
2<br />
4<br />
9<br />
9<br />
Average Asking Price<br />
GL EXPRESS<br />
GL6000<br />
Market Indicators (vs. Last Quarter)<br />
$32.7<br />
$32.0<br />
$36.7<br />
$31.1<br />
GL XRS<br />
GL5000<br />
Average<br />
GLOBAL 5000<br />
Transaction Level (Past 12 Months)<br />
Inventory Level<br />
Average Asking Price<br />
$30.5<br />
$27.0<br />
$26.0<br />
Average Days on Market<br />
$17.5<br />
$16.2<br />
$16.9 $15.9<br />
$9.3<br />
$9.6<br />
For Sale vs. Sold<br />
Sold For Sale<br />
3<br />
4 5<br />
5 3 4<br />
8<br />
$19.3<br />
$17.5<br />
$9.6<br />
6 10<br />
1<br />
6<br />
$17.0 $16.1<br />
$14.5 $15.0<br />
$14.4 $14.8<br />
$13.6<br />
$14.9<br />
$9.0 $8.2 $7.5 $8.0<br />
13<br />
9 8 6<br />
7 7<br />
3 3 4<br />
6<br />
9<br />
5<br />
8 3<br />
GLOBAL EXPRESS<br />
Transaction Level (Past 12 Months)<br />
Inventory Level<br />
Average Asking Price<br />
Average Days on Market<br />
GLOBAL XRS<br />
Transaction Level (Past 12 Months)<br />
Inventory Level<br />
Average Asking Price<br />
Average Days on Market<br />
69 73 67 62 64 63 67<br />
65 60 64<br />
60 64 70 73 78 77 75 81 82 79 81 80 69 73 69<br />
GLOBAL 6000<br />
Transaction Level (Past 12 Months)<br />
Inventory Level<br />
Average Asking Price<br />
Mar May Jul Sep Nov Jan Mar May Jul Sep Nov Jan Mar<br />
2019 2020 2021<br />
Average Days on Market<br />
Source: AMSTAT & ASG<br />
FEATURED AIRCRAFT<br />
66 | ASIAN SKY QUARTERLY — FIRST QUARTER 2021
MARKET SUMMARY<br />
CITATION CJ3 & CJ4<br />
PERFORMANCE<br />
Max Range<br />
Max Speed<br />
Typ. Passengers<br />
Cit. CJ3<br />
1,891 N.M. / 3,502 km<br />
Mach 0.73<br />
6<br />
Cit. CJ4<br />
1,991 N.M. / 3,687 km<br />
Mach 0.77<br />
7<br />
SUPPLY<br />
No. for Sale<br />
Avg Asking Price<br />
Avg Days on Market<br />
2021 Mar 2020 Dec 2021 Mar 2020 Dec<br />
23 (3.9%) 35 (6.0%) 11 (3.3%) 17 (5.2%)<br />
5.2M USD 4.3M USD 6.9M USD 5.5M USD<br />
254 252<br />
152 212<br />
TRANSACTION<br />
Past 12 Months<br />
Past 3 Months<br />
2021 Mar 2020 Dec 2021 Mar 2020 Dec<br />
66 59<br />
30 23<br />
7<br />
20<br />
7<br />
11<br />
Average Asking Price<br />
CJ4<br />
CJ3<br />
Average<br />
Market Indicators (vs. Last Quarter)<br />
Cit. CJ3<br />
Transaction Level (Past 12 Months)<br />
$6.6<br />
$6.3<br />
$5.9<br />
$6.3<br />
$6.9<br />
Inventory Level<br />
Average Asking Price<br />
Average Days on Market<br />
$5.6<br />
$5.1<br />
$5.2<br />
Cit. CJ4<br />
Transaction Level (Past 12 Months)<br />
$4.4 $4.3<br />
$4.1<br />
$4.0<br />
$4.3 $4.3<br />
Inventory Level<br />
Average Asking Price<br />
For Sale vs. Sold<br />
Sold For Sale<br />
8<br />
4 9 9 8<br />
4 3<br />
10<br />
8<br />
13<br />
6<br />
5<br />
8<br />
4<br />
5<br />
5<br />
12<br />
17<br />
8<br />
14<br />
7<br />
10<br />
8<br />
3<br />
3<br />
Average Days on Market<br />
45 46 54 50 51 51<br />
50<br />
54 62 61<br />
62 70 69 74 74 81 76 72 73 63 60 52 37 34 34<br />
Mar May Jul Sep Nov Jan Mar May Jul Sep Nov Jan Mar<br />
2019 2020 2021<br />
Source: AMSTAT & ASG<br />
FIRST QUARTER 2021 — ASIAN SKY QUARTERLY | 67
MARKET SUMMARY<br />
CITATION LATITUDE<br />
Average Asking Price<br />
Market Indicators (vs. Last Quarter)<br />
$13.7<br />
$13.5<br />
$13.4<br />
$13.5 $13.5<br />
Transaction Level (Past 12 Months)<br />
Inventory Level<br />
Average Asking Price<br />
$13.0<br />
Average Days on Market<br />
For Sale vs. Sold<br />
$12.0<br />
PERFORMANCE<br />
Max Range<br />
Max Speed<br />
Typ. Passengers<br />
2,870N.M. / 5,315 km<br />
Mach 0.80<br />
9<br />
Sold<br />
For Sale<br />
2<br />
1<br />
1<br />
2<br />
2<br />
1 1 1<br />
3<br />
SUPPLY<br />
No. for Sale<br />
Avg Asking Price<br />
Avg Days on Market<br />
2021 Mar 2020 Dec<br />
6 (2.3%) 7 (2.9%)<br />
13.5M USD 13.5M USD<br />
160 199<br />
4 4 5 5 5 5<br />
5<br />
7 6 6<br />
8 7 5 5 5 6 6 6 6 7 7 7 6 7 6<br />
TRANSACTION<br />
Past 12 Months<br />
Past 3 Months<br />
2021 Mar 2020 Dec<br />
8 4<br />
4 2<br />
Mar May Jul Sep Nov Jan Mar May Jul Sep Nov Jan Mar<br />
2019 2020 2021<br />
CITATION SOVEREIGN<br />
Average Asking Price<br />
Market Indicators (vs. Last Quarter)<br />
$7.7<br />
$7.8<br />
$7.0<br />
$6.9<br />
$6.8<br />
$7.4<br />
Transaction Level (Past 12 Months)<br />
Inventory Level<br />
Average Asking Price<br />
$5.7<br />
Average Days on Market<br />
For Sale vs. Sold<br />
PERFORMANCE<br />
Max Range<br />
Max Speed<br />
Typ. Passengers<br />
3,010N.M. / 5,574 km<br />
Mach 0.80<br />
9<br />
Sold<br />
4<br />
1<br />
22 24<br />
For Sale<br />
2 2<br />
4<br />
22 22 22<br />
3<br />
20<br />
2<br />
24<br />
2<br />
19<br />
1<br />
24<br />
8<br />
24<br />
4<br />
22<br />
4<br />
4 1 1 1<br />
25 27 29 30 32 36 36 38<br />
1<br />
4<br />
7<br />
11<br />
1 3<br />
1<br />
2<br />
33 35 33 24 21 24<br />
SUPPLY<br />
No. for Sale<br />
Avg Asking Price<br />
Avg Days on Market<br />
TRANSACTION<br />
Past 12 Months<br />
Past 3 Months<br />
2021 Mar 2020 Dec<br />
24 (5.4%) 33 (7.5%)<br />
5.7M USD 7.8M USD<br />
210 210<br />
2021 Mar 2020 Dec<br />
33 30<br />
3 15<br />
Mar May Jul Sep Nov Jan Mar May Jul Sep Nov Jan Mar<br />
2019 2020 2021<br />
Source: AMSTAT & ASG<br />
68 | ASIAN SKY QUARTERLY — FIRST QUARTER 2021
MARKET SUMMARY<br />
FALCON 900DX/EX/EX EASy/LX<br />
PERFORMANCE<br />
Max Range<br />
Max Speed<br />
Typ. Passengers<br />
F900DX<br />
4,100 N.M. /7,593 km<br />
Mach 0.83<br />
12<br />
F900EX<br />
4,500 N.M. /8,334 km<br />
Mach 0.83<br />
12<br />
F900EX EASy<br />
4,500 N.M. /8,334 km<br />
Mach 0.83<br />
12<br />
F900LX<br />
4,750 N.M. /8,800 km<br />
Mach 0.83<br />
12<br />
SUPPLY<br />
No. for Sale<br />
Avg Asking Price<br />
Avg Days on Market<br />
2021 Mar 2020 Dec 2021 Mar 2020 Dec 2021 Mar 2020 Dec 2021 Mar 2020 Dec<br />
1 (4.2%) 1 (4.2%) 8 (6.8%) 9 (7.6%) 5 (4.2%) 8 (6.7%) 4 (5.0%) 2 (2.5%)<br />
12.3M USD 12.4M USD 7.5M USD 7.8M USD 11.4M USD 12.0M USD 17.5M USD 19.5M USD<br />
133 43<br />
221 207<br />
337 303<br />
163 168<br />
TRANSACTION<br />
Past 12 Months<br />
Past 3 Months<br />
2021 Mar 2020 Dec 2021 Mar 2020 Dec 2021 Mar 2020 Dec 2021 Mar 2020 Dec<br />
4<br />
4<br />
7<br />
6<br />
13 10<br />
5<br />
4<br />
0<br />
1<br />
1<br />
3<br />
3<br />
5<br />
1<br />
1<br />
Average Asking Price<br />
F900EX EASy<br />
F900LX<br />
F900EX<br />
F900DX<br />
Average<br />
Market Indicators (vs. Last Quarter)<br />
F900DX<br />
Transaction Level (Past 12 Months)<br />
Inventory Level<br />
$24.5 $24.5<br />
$21.7 $21.0<br />
$14.7 $15.4<br />
$14.8 $14.6<br />
$12.0<br />
$12.7 $13.4 $12.7<br />
$6.9 $7.5 $6.6 $7.8<br />
For Sale vs. Sold<br />
Sold For Sale<br />
$21.0<br />
$19.5<br />
$17.5<br />
$13.0<br />
$12.4<br />
$12.3<br />
$12.3<br />
$12.3<br />
$11.4<br />
$7.8 $7.7 $7.5<br />
Average Asking Price<br />
Average Days on Market<br />
F900EX<br />
Transaction Level (Past 12 Months)<br />
Inventory Level<br />
Average Asking Price<br />
Average Days on Market<br />
F900EX EASy<br />
Transaction Level (Past 12 Months)<br />
Inventory Level<br />
Average Asking Price<br />
2<br />
1<br />
2<br />
6<br />
2<br />
2<br />
2<br />
2<br />
4<br />
1<br />
8 1<br />
1<br />
1 2 2 1<br />
5 3<br />
2<br />
7<br />
3<br />
1<br />
1<br />
1<br />
Average Days on Market<br />
F900LX<br />
Transaction Level (Past 12 Months)<br />
Inventory Level<br />
19 18 16 17 17 16 15 16 21 20 22 29 32 31 28 27 26 24 26 25 21 20 23 18 18<br />
Mar May Jul Sep Nov Jan Mar May Jul Sep Nov Jan Mar<br />
2019 2020 2021<br />
Average Asking Price<br />
Average Days on Market<br />
Source: AMSTAT & ASG<br />
FIRST QUARTER 2021 — ASIAN SKY QUARTERLY | 69
MARKET SUMMARY<br />
FALCON 2000LX/LXS/S<br />
PERFORMANCE<br />
Max Range<br />
Max Speed<br />
Typ. Passengers<br />
F2000LX<br />
4,000 N.M. /7,408 km<br />
Mach 0.83<br />
10<br />
F2000LXS<br />
4,000 N.M. /7,408 km<br />
Mach 0.83<br />
10<br />
F2000S<br />
3,350 N.M. /6,208 km<br />
Mach 0.83<br />
10<br />
SUPPLY<br />
No. for Sale<br />
Avg Asking Price<br />
Avg Days on Market<br />
2021 Mar 2020 Dec 2021 Mar 2020 Dec 2021 Mar 2020 Dec<br />
5 (3.8%) 7 (5.3%) 7 (6.9%) 7 (6.9%) 1 (2.3%) 1 (2.3%)<br />
9.1M USD 10.8M USD 19.6M USD 21.0M USD 27.7M USD 27.7M USD<br />
127 194<br />
273 272<br />
11 440<br />
TRANSACTION<br />
Past 12 Months<br />
Past 3 Months<br />
2021 Mar 2020 Dec 2021 Mar 2020 Dec 2021 Mar 2020 Dec<br />
10 7<br />
6<br />
3<br />
1<br />
1<br />
3<br />
6<br />
3<br />
3<br />
0<br />
0<br />
$24.5<br />
$23.5<br />
Average Asking Price<br />
$27.7 $27.7<br />
$23.0 $22.3 $24.8<br />
$27.7<br />
$21.5<br />
F2000S<br />
F2000LXS<br />
F2000LX<br />
Average<br />
$27.7<br />
$19.0<br />
$27.7<br />
$19.6<br />
Market Indicators (vs. Last Quarter)<br />
F2000LX<br />
Transaction Level (Past 12 Months)<br />
Inventory Level<br />
Average Asking Price<br />
Average Days on Market<br />
F2000LXS<br />
Transaction Level (Past 12 Months)<br />
$16.0<br />
$14.2 $13.9<br />
$0.0<br />
$14.5<br />
$12.0<br />
$11.0<br />
$9.1<br />
Inventory Level<br />
Average Asking Price<br />
Average Days on Market<br />
F2000S<br />
Transaction Level (Past 12 Months)<br />
For Sale vs. Sold<br />
3<br />
Inventory Level<br />
Sold<br />
1<br />
1<br />
For Sale<br />
2<br />
1<br />
1<br />
1<br />
2<br />
1<br />
2<br />
1<br />
1<br />
1<br />
3<br />
3<br />
2<br />
1<br />
3<br />
Average Asking Price<br />
Average Days on Market<br />
8 11 11 11 11 13<br />
12<br />
14 16 16<br />
16 16 15 16 16 17 15 15 15 20 16 15 13 8 13<br />
Mar May Jul Sep Nov Jan Mar May Jul Sep Nov Jan Mar<br />
2019 2020 2021<br />
Source: AMSTAT & ASG<br />
70 | ASIAN SKY QUARTERLY — FIRST QUARTER 2021
MARKET SUMMARY<br />
FALCON 7X<br />
Average Asking Price<br />
Market Indicators (vs. Last Quarter)<br />
$27.8<br />
Transaction Level (Past 12 Months)<br />
Inventory Level<br />
Average Asking Price<br />
Average Days on Market<br />
$22.1<br />
$21.2<br />
$23.3<br />
$19.9<br />
$20.4<br />
$21.8<br />
PERFORMANCE<br />
Max Range<br />
Max Speed<br />
5,950 N.M. / 11,018 km<br />
Mach 0.90<br />
For Sale vs. Sold<br />
Typ. Passengers<br />
12<br />
Sold<br />
For Sale<br />
SUPPLY<br />
No. for Sale<br />
2021 Mar 2020 Dec<br />
17 (5.8%) 19 (6.5%)<br />
3<br />
5<br />
3<br />
2 2<br />
1<br />
2<br />
1<br />
3<br />
2<br />
1<br />
1<br />
2<br />
2<br />
1<br />
1<br />
0<br />
2<br />
1<br />
1<br />
6<br />
5<br />
1<br />
1<br />
Avg Asking Price<br />
Avg Days on Market<br />
21.8M USD<br />
264<br />
19.7M USD<br />
259<br />
18 17 17 16 16 17<br />
19<br />
18 14<br />
15<br />
20 22 20 24 26 15 19 20 19 20 24 19 13 15 17<br />
TRANSACTION<br />
Past 12 Months<br />
Past 3 Months<br />
2021 Mar 2020 Dec<br />
21 19<br />
2 12<br />
Mar May Jul Sep Nov Jan Mar May Jul Sep Nov Jan Mar<br />
2019 2020 2021<br />
Source: AMSTAT & ASG<br />
FIRST QUARTER 2021 — ASIAN SKY QUARTERLY | 71
MARKET SUMMARY<br />
PHENOM 300<br />
Average Asking Price<br />
Market Indicators (vs. Last Quarter)<br />
$7.2<br />
Transaction Level (Past 12 Months)<br />
$6.9<br />
$6.9<br />
$7.1<br />
Inventory Level<br />
Average Asking Price<br />
Average Days on Market<br />
$6.8<br />
For Sale vs. Sold<br />
$6.6<br />
$6.6<br />
PERFORMANCE<br />
Max Range<br />
Max Speed<br />
Typ. Passengers<br />
1,242 N.M. / 2,300 km<br />
Mach 0.78<br />
5<br />
Sold For Sale<br />
3 3 2 2<br />
4<br />
5<br />
3 3 2<br />
3<br />
1<br />
2<br />
0<br />
2<br />
7 3<br />
5<br />
2 1<br />
5<br />
9<br />
3<br />
4<br />
6<br />
SUPPLY<br />
No. for Sale<br />
Avg Asking Price<br />
Avg Days on Market<br />
2021 Mar 2020 Dec<br />
28 (4.8%) 38 (6.7%)<br />
7.1M USD 6.7M USD<br />
327 267<br />
18 19 18 19 19 20<br />
22<br />
20 22<br />
22<br />
22 27 28 33 35 36 38 35 38 42 41 38 36 31 28<br />
TRANSACTION<br />
Past 12 Months<br />
Past 3 Months<br />
2021 Mar 2020 Dec<br />
47 34<br />
13 17<br />
Mar May Jul Sep Nov Jan Mar May Jul Sep Nov Jan Mar<br />
2019 2020 2021<br />
LEGACY 600/650<br />
Average Asking Price<br />
L650<br />
Market Indicators (vs. Last Quarter)<br />
L600<br />
Average<br />
Transaction Level (Past 12 Months)<br />
L600<br />
L650<br />
$15.1 $15.1 $15.0<br />
$14.0<br />
$15.0<br />
$13.1<br />
Inventory Level<br />
Average Asking Price<br />
$12.3<br />
Average Days on Market<br />
$6.8 $6.7<br />
For Sale vs. Sold<br />
Sold For Sale<br />
$5.1<br />
$9.2 $8.1<br />
$7.0<br />
$7.2<br />
PERFORMANCE<br />
Max Range<br />
Max Speed<br />
Typ. Passengers<br />
L600 L650<br />
3,400 N.M. 3,640 N.M.<br />
6,297 km 7,112 km<br />
Mach 0.80 Mach 0.80<br />
13 13<br />
1<br />
2<br />
1<br />
4<br />
3<br />
3<br />
2<br />
2<br />
1<br />
3<br />
2<br />
3<br />
3<br />
1<br />
1 4<br />
2<br />
5<br />
1<br />
2<br />
2<br />
5<br />
SUPPLY<br />
No. for Sale<br />
Avg Asking Price<br />
Avg Days on Market<br />
Mar | Dec<br />
11 | 12<br />
7.2M USD<br />
6.9M USD<br />
383 | 397<br />
Mar | Dec<br />
7 | 4<br />
12.3M USD<br />
13.1M USD<br />
162 | 182<br />
25<br />
23 21 22 24 21 21<br />
22 21<br />
25<br />
23 19 22<br />
24 21 19<br />
17 15 15<br />
17 17 16 18 17 18<br />
Mar May Jul Sep Nov Jan Mar May Jul Sep Nov Jan Mar<br />
2019 2020 2021<br />
TRANSACTION<br />
Past 12 Months<br />
Past 3 Months<br />
Mar | Dec<br />
16 | 12<br />
4 | 6<br />
Mar | Dec<br />
7 | 4<br />
3 | 2<br />
Source: AMSTAT & ASG<br />
72 | ASIAN SKY QUARTERLY — FIRST QUARTER 2021
MARKET SUMMARY<br />
LINEAGE 1000/E<br />
Average Asking Price<br />
Market Indicators (vs. Last Quarter)<br />
$21.4<br />
$21.4<br />
$20.2<br />
$19.1<br />
$17.7<br />
Transaction Level (Past 12 Months)<br />
Inventory Level<br />
Average Asking Price<br />
$17.7<br />
Average Days on Market<br />
$9.9<br />
For Sale vs. Sold<br />
PERFORMANCE<br />
Max Range<br />
Max Speed<br />
Typ. Passengers<br />
4,400 N.M. / 8,149 km<br />
Mach 0.82<br />
19<br />
Sold<br />
For Sale<br />
1<br />
1<br />
SUPPLY<br />
No. for Sale<br />
Avg Asking Price<br />
Avg Days on Market<br />
2021 Mar 2020 Dec<br />
3 (10.0%) 4 (14.3%)<br />
9.9M USD 7.5M USD<br />
961 767<br />
9 9 9 9 9 8<br />
8<br />
9 10<br />
10<br />
7 6 6 6 5 5 4 4 4 4 4 4 4 4 3<br />
TRANSACTION<br />
Past 12 Months<br />
Past 3 Months<br />
2021 Mar 2020 Dec<br />
0 0<br />
0 0<br />
Mar May Jul Sep Nov Jan Mar May Jul Sep Nov Jan Mar<br />
2019 2020 2021<br />
G200<br />
Average Asking Price<br />
Market Indicators (vs. Last Quarter)<br />
$4.6<br />
$4.4<br />
$4.2<br />
$4.0<br />
Transaction Level (Past 12 Months)<br />
Inventory Level<br />
Average Asking Price<br />
$4.1<br />
$3.6<br />
Average Days on Market<br />
For Sale vs. Sold<br />
$3.4<br />
PERFORMANCE<br />
Max Range<br />
Max Speed<br />
Typ. Passengers<br />
3,050 N.M. / 5,651 km<br />
Mach 0.81<br />
8<br />
1<br />
Sold<br />
1<br />
4<br />
For Sale<br />
2 2<br />
4<br />
1<br />
3<br />
1<br />
3<br />
7<br />
3<br />
2<br />
5<br />
3<br />
1<br />
2<br />
4<br />
5<br />
3<br />
1<br />
2 2<br />
SUPPLY<br />
No. for Sale<br />
Avg Asking Price<br />
Avg Days on Market<br />
2021 Mar 2020 Dec<br />
19 (7.9%) 18 (7.5%)<br />
3.4M USD 3.6M USD<br />
221 276<br />
21 25 27 27 27 28<br />
28<br />
25 27<br />
24<br />
22 22 21 25 26 31 27 24 21 20 21 18 19 19 19<br />
TRANSACTION<br />
Past 12 Months<br />
Past 3 Months<br />
2021 Mar 2020 Dec<br />
28 21<br />
7 10<br />
Mar May Jul Sep Nov Jan Mar May Jul Sep Nov Jan Mar<br />
2019 2020 2021<br />
Source: AMSTAT & ASG<br />
FIRST QUARTER 2021 — ASIAN SKY QUARTERLY | 73
MARKET SUMMARY<br />
G280<br />
Average Asking Price<br />
Market Indicators (vs. Last Quarter)<br />
Transaction Level (Past 12 Months)<br />
$16.3<br />
$15.4<br />
Inventory Level<br />
$14.2<br />
Average Asking Price<br />
$14.5<br />
Average Days on Market<br />
$12.5<br />
$13.0<br />
$11.7<br />
PERFORMANCE<br />
Max Range<br />
3,600 N.M. / 6,667 km<br />
Max Speed<br />
Mach 0.84<br />
For Sale vs. Sold<br />
Typ. Passengers<br />
8<br />
Sold<br />
For Sale<br />
6<br />
1<br />
1<br />
1<br />
2<br />
1<br />
SUPPLY<br />
No. for Sale<br />
Avg Asking Price<br />
Avg Days on Market<br />
2021 Mar 2020 Dec<br />
12 (5.8%) 16 (8.0%)<br />
11.7M USD 14.2M USD<br />
259 257<br />
4 4<br />
4 7 9 8 9 10 12<br />
11<br />
9 12 13 14 15 15 15 13 15 15 15 16 10 13 12<br />
Mar May Jul Sep Nov Jan Mar May Jul Sep Nov Jan Mar<br />
2019 2020 2021<br />
TRANSACTION<br />
Past 12 Months<br />
Past 3 Months<br />
2021 Mar 2020 Dec<br />
9 9<br />
0 7<br />
G450<br />
Average Asking Price<br />
Market Indicators (vs. Last Quarter)<br />
Transaction Level (Past 12 Months)<br />
$15.5<br />
$16.4<br />
Inventory Level<br />
Average Asking Price<br />
$13.6<br />
$14.2<br />
Average Days on Market<br />
$12.9<br />
$12.5<br />
$12.5<br />
PERFORMANCE<br />
Max Range<br />
4,350 N.M. / 8,056 km<br />
Max Speed<br />
Mach 0.85<br />
For Sale vs. Sold<br />
Typ. Passengers<br />
13<br />
4<br />
Sold<br />
3<br />
For Sale<br />
1 2<br />
2<br />
4<br />
2<br />
5<br />
3<br />
1<br />
2<br />
1<br />
1<br />
3<br />
3<br />
1<br />
3<br />
2 4<br />
1<br />
7<br />
3<br />
4<br />
3<br />
SUPPLY<br />
No. for Sale<br />
Avg Asking Price<br />
Avg Days on Market<br />
2021 Mar 2020 Dec<br />
34 (9.6%) 27 (7.6%)<br />
12.5M USD 12.2M USD<br />
310 324<br />
22 25 22 21 23 23 23 21 28 29 26 28 29 31 29 28 30 28 29 30 27 27 32 32 34<br />
Mar May Jul Sep Nov Jan Mar May Jul Sep Nov Jan Mar<br />
TRANSACTION<br />
Past 12 Months<br />
Past 3 Months<br />
2021 Mar 2020 Dec<br />
35 25<br />
10 14<br />
2019 2020 2021 Source: AMSTAT & ASG<br />
74 | ASIAN SKY QUARTERLY — FIRST QUARTER 2021
MARKET SUMMARY<br />
G550<br />
Average Asking Price<br />
Market Indicators (vs. Last Quarter)<br />
$25.6<br />
Transaction Level (Past 12 Months)<br />
$22.4<br />
Inventory Level<br />
Average Asking Price<br />
$22.5<br />
For Sale vs. Sold<br />
$20.2<br />
$18.3<br />
$19.1<br />
$16.1<br />
Average Days on Market<br />
PERFORMANCE<br />
Max Range<br />
Max Speed<br />
Typ. Passengers<br />
6,750 N.M. / 12,501 km<br />
Mach 0.87<br />
18<br />
3<br />
Sold<br />
4<br />
2<br />
For Sale<br />
3<br />
2 2<br />
13<br />
27 18 18 19 24 31 32 31 33 33<br />
3<br />
2<br />
4 2 2<br />
39 42<br />
41<br />
1<br />
44<br />
2 1<br />
45<br />
45<br />
3 4 5 4 6<br />
13<br />
45 44 44 46 43 32 26 28 30<br />
2<br />
1<br />
3<br />
SUPPLY<br />
No. for Sale<br />
Avg Asking Price<br />
Avg Days on Market<br />
TRANSACTION<br />
Past 12 Months<br />
Past 3 Months<br />
2021 Mar 2020 Dec<br />
30 (5.0%) 32 (5.4%)<br />
16.1M USD 19.8M USD<br />
201 276<br />
2021 Mar 2020 Dec<br />
45 39<br />
6 23<br />
Mar May Jul Sep Nov Jan Mar May Jul Sep Nov Jan Mar<br />
2019 2020 2021<br />
G650 & G650 ER<br />
Average Asking Price<br />
G650ER<br />
Market Indicators (vs. Last Quarter)<br />
$60.5<br />
G650<br />
Average<br />
Transaction Level (Past 12 Months)<br />
G650<br />
G650ER<br />
$48.0<br />
$51.2<br />
$45.9<br />
For Sale vs. Sold<br />
Sold For Sale<br />
$51.9<br />
$45.6<br />
$49.2<br />
$41.0<br />
$45.2<br />
$37.1<br />
$42.0<br />
$39.0<br />
$40.2<br />
$30.2<br />
Inventory Level<br />
Average Asking Price<br />
Average Days on Market<br />
PERFORMANCE<br />
Max Range<br />
Max Speed<br />
Typ. Passengers<br />
G650 G650ER<br />
7,000 N.M. 7,500 N.M.<br />
12,964 km 13,890 km<br />
Mach 0.90 Mach 0.90<br />
18 18<br />
2<br />
1<br />
1 1 1 1<br />
1<br />
2 2<br />
2<br />
6<br />
2<br />
2<br />
6<br />
16<br />
5<br />
1<br />
3<br />
SUPPLY<br />
No. for Sale<br />
Avg Asking Price<br />
Avg Days on Market<br />
Mar | Dec<br />
5 | 8<br />
30.2M USD<br />
37.8M USD<br />
241 | 225<br />
Mar | Dec<br />
7 | 6<br />
40.2M USD<br />
47.8M USD<br />
118 | 183<br />
10 15 16 15 16 16<br />
16<br />
17 15<br />
17<br />
13 13 13<br />
16 14 17<br />
20 20 23 24 21 14 13 12 12<br />
Mar May Jul Sep Nov Jan Mar May Jul Sep Nov Jan Mar<br />
2019 2020 2021<br />
TRANSACTION<br />
Past 12 Months<br />
Past 3 Months<br />
Mar | Dec Mar | Dec<br />
21 | 17 22 | 17<br />
4 | 11 5 | 11<br />
Source: AMSTAT & ASG<br />
FIRST QUARTER 2021 — ASIAN SKY QUARTERLY | 75
The International Aircraft Dealers Association<br />
is the collective force influencing and shaping the<br />
aircraft transaction industry.<br />
Experience the power of the collective.<br />
AIRCRAFTEXCHANGE.COM<br />
76 | ASIAN SKY QUARTERLY — FIRST QUARTER 2021
AIRCRAFT POSITIONING - CIVIL HELICOPTERS<br />
ACQUISITION COST VS. MAX RANGE<br />
AIRCRAFT ACQUISITION PRICE (MILLION USD)<br />
6<br />
5<br />
4<br />
3<br />
2<br />
1<br />
0<br />
HEAVY<br />
(SUPER) MEDIUM<br />
LIGHT TWIN<br />
SINGLE TURBINE<br />
PISTON<br />
ACQUISITION COST VS. MAX TAKEOFF WEIGHT<br />
AIRCRAFT ACQUISITION PRICE (MILLION USD)<br />
8<br />
4<br />
2<br />
1<br />
0.5<br />
0.25<br />
1000<br />
HEAVY<br />
(SUPER) MEDIUM<br />
LIGHT TWIN<br />
SINGLE TURBINE<br />
PISTON<br />
ACQUISITION COST VS. CABIN VOLUME<br />
AIRCRAFT ACQUISITION PRICE (MILLION USD)<br />
8<br />
4<br />
2<br />
1<br />
0.5<br />
0.25<br />
20<br />
100<br />
HEAVY<br />
(SUPER) MEDIUM<br />
LIGHT TWIN<br />
SINGLE TURBINE<br />
PISTON<br />
EN480B<br />
2000<br />
40<br />
MD902<br />
BELL 206L4<br />
MD530F<br />
MD502N MD600N<br />
MD550E R66<br />
R22 BETA II<br />
R44 RAVEN II<br />
MD 530F<br />
MD500E<br />
EN480B<br />
R66<br />
R44 RAVEN II<br />
R22 BETA II<br />
MD 520N<br />
R44 RAVEN II<br />
R22 BETA II<br />
MD 500E<br />
R66<br />
H135(T3)<br />
BELL 412EPI<br />
80<br />
4000<br />
S-76D<br />
H215(C1)<br />
S-76C++<br />
H145<br />
200 300 400<br />
500<br />
600 700<br />
MD520N<br />
MD530F<br />
H125<br />
H130<br />
H120<br />
H120<br />
BELL 505<br />
BELL 430<br />
MD 902<br />
H135(T3)<br />
MAXIMUM RANGE (N.M)<br />
MD 902<br />
H135(T3)<br />
AW109 POWER<br />
BELL 407GXP<br />
MAX TAKE-OFF WEIGHT (LBS)<br />
BELL 407GXP<br />
MD 600N<br />
H225<br />
BELL 429<br />
BELL 407GXP<br />
BELL 407<br />
BELL 206L4<br />
160<br />
CABIN VOLUMN (CU.FT)<br />
S-92<br />
BELL 505<br />
EN480B BELL 407<br />
MD 600N<br />
BELL 505<br />
H155<br />
AW169<br />
AW109 GRANDNEW<br />
AW109 POWER<br />
H125<br />
H130 AW119KX<br />
H120<br />
8000<br />
H175<br />
AW139<br />
16000<br />
S-76D H155<br />
BELL430<br />
AW139<br />
H145<br />
AW169<br />
BELL412EPI<br />
BELL429 AW109 GRANDNEW<br />
AW109 POWER<br />
AW119KX<br />
S-76C++<br />
H225<br />
AW189<br />
H155<br />
H215(C1)<br />
H145<br />
S-76D<br />
AW189<br />
AW169<br />
H175<br />
AW139<br />
BELL 429<br />
BELL 412EPI<br />
S-76C++<br />
BELL 430<br />
AW109 GRANDNEW<br />
AW119KX<br />
H130<br />
H125 BELL 407 BELL 206L4<br />
H215(C1) S-92<br />
H175<br />
AW189<br />
H225<br />
S-92<br />
32000<br />
320 640 800<br />
Source: Conklin & de Decker<br />
MARKET SUMMARY<br />
FIRST QUARTER 2021 — ASIAN SKY QUARTERLY | 77
MARKET SUMMARY PER MODEL — CIVIL HELICOPTERS<br />
INVENTORY LEVEL, PRICE TREND & TRANSACTIONS<br />
H125<br />
Average Asking Price<br />
Market Indicators (vs. Last Quarter)<br />
Transaction Level (Past 12 Months)<br />
$2.4<br />
$2.4<br />
Inventory Level<br />
Average Asking Price<br />
$2.4<br />
$2.4<br />
$2.4<br />
$2.4<br />
$2.4<br />
Average Days on Market<br />
For Sale vs. Sold<br />
PERFORMANCE<br />
Max Range<br />
Max Speed<br />
Typ. Passengers<br />
340 N.M. / 630 km<br />
140 Knots<br />
6<br />
Sold For Sale<br />
5 4 8<br />
2<br />
1<br />
2<br />
2 1<br />
1<br />
2 3<br />
3<br />
3<br />
2<br />
2<br />
4<br />
2<br />
3<br />
3<br />
2<br />
SUPPLY<br />
No. for Sale<br />
Avg Asking Price<br />
Avg Days on Market<br />
2021 Mar<br />
38 (4.3%)<br />
2.4M USD<br />
470<br />
2020 Dec<br />
27 (3.1%)<br />
2.5M USD<br />
562<br />
31 32 33 29 27 29<br />
25<br />
26 27<br />
25<br />
27 26 26<br />
24 26 26 26 28 25 26 26 27 31 36 38<br />
TRANSACTION<br />
Past 12 Months<br />
2021 Mar<br />
24<br />
2020 Dec<br />
19<br />
Past 3 Months<br />
5<br />
3<br />
Mar May Jul Sep Nov Jan Mar May Jul Sep Nov Jan Mar<br />
2019 2020 2021<br />
H130<br />
Average Asking Price<br />
Market Indicators (vs. Last Quarter)<br />
$3.1<br />
$3.1<br />
$3.0<br />
$3.1<br />
Transaction Level (Past 12 Months)<br />
Inventory Level<br />
$2.9<br />
Average Asking Price<br />
$2.7<br />
$2.8<br />
Average Days on Market<br />
For Sale vs. Sold<br />
PERFORMANCE<br />
Max Range<br />
Max Speed<br />
Typ. Passengers<br />
333 N.M. / 606km<br />
128 Knots<br />
7<br />
Sold<br />
For Sale<br />
1<br />
4<br />
2<br />
3<br />
4<br />
SUPPLY<br />
No. for Sale<br />
2021 Mar<br />
9 (3.0%)<br />
2020 Dec<br />
15 (5.1%)<br />
1 1 1<br />
2<br />
1<br />
2<br />
1<br />
1<br />
1<br />
1<br />
Avg Asking Price<br />
Avg Days on Market<br />
2.9M USD<br />
311<br />
2.7M USD<br />
229<br />
10 10 9 10 11 10<br />
10<br />
11 9<br />
9<br />
9 9 7 8 11 11 12 14 16 16 15 15 12 10 9<br />
Mar May Jul Sep Nov Jan Mar May Jul Sep Nov Jan Mar<br />
2019 2020 2021<br />
TRANSACTION<br />
Past 12 Months<br />
Past 3 Months<br />
2021 Mar<br />
18<br />
6<br />
2020 Dec<br />
12<br />
5<br />
Source: AMSTAT & ASG<br />
78 | ASIAN SKY QUARTERLY — FIRST QUARTER 2021
MARKET SUMMARY<br />
EC135P2 & T2<br />
Average Asking Price<br />
EC135T2<br />
EC135P2<br />
Average<br />
Market Indicators (vs. Last Quarter)<br />
Transaction Level (Past 12 Months)<br />
EC135P2 EC135T2<br />
$2.6<br />
$2.1<br />
$2.5<br />
$1.7<br />
$2.2<br />
$1.7<br />
$2.5<br />
$2.2<br />
$1.7<br />
$2.2<br />
$1.7 $1.7<br />
$2.0<br />
$1.7<br />
Inventory Level<br />
Average Asking Price<br />
Average Days on Market<br />
For Sale vs. Sold<br />
Sold For Sale<br />
PERFORMANCE<br />
Max Range<br />
Max Speed<br />
Typ. Passengers<br />
EC135P2<br />
332 N.M.<br />
614 km<br />
127 Knots<br />
6<br />
EC135T2<br />
332 N.M.<br />
614 km<br />
127 Knots<br />
6<br />
1<br />
1<br />
1<br />
1 1 2<br />
1<br />
2<br />
1<br />
SUPPLY<br />
No. for Sale<br />
Avg Asking Price<br />
Avg Days on Market<br />
Mar | Dec<br />
8 | 5<br />
2.0M USD<br />
2.5M USD<br />
390 | 522<br />
Mar | Dec<br />
1 | 2<br />
1.7M USD<br />
1.7M USD<br />
236 | 223<br />
10 11 12 12 11 11<br />
11 11 10 11 10 8 9 9 8 8 7 8 8 7 7 7 10 9 9<br />
Mar May Jul Sep Nov Jan Mar May Jul Sep Nov Jan Mar<br />
2019 2020 2021<br />
TRANSACTION<br />
Past 12 Months<br />
Past 3 Months<br />
Mar | Dec<br />
4 | 2<br />
2 | 0<br />
Mar | Dec<br />
6 | 4<br />
2 | 2<br />
EC145<br />
Average Asking Price<br />
Market Indicators (vs. Last Quarter)<br />
$5.1<br />
Transaction Level (Past 12 Months)<br />
Inventory Level<br />
$4.3<br />
Average Asking Price<br />
$3.9<br />
$3.9<br />
$3.7<br />
Average Days on Market<br />
$3.9<br />
For Sale vs. Sold<br />
$2.9<br />
PERFORMANCE<br />
Max Range<br />
Max Speed<br />
Typ. Passengers<br />
461 N.M. / 855 km<br />
131 Knots<br />
9<br />
2<br />
Sold<br />
1<br />
For Sale<br />
3<br />
2<br />
2<br />
1<br />
3<br />
4<br />
1<br />
3<br />
2<br />
1<br />
1 1<br />
2<br />
2<br />
1<br />
SUPPLY<br />
No. for Sale<br />
Avg Asking Price<br />
Avg Days on Market<br />
2021 Mar 2020 Dec<br />
7 (1.0%) 7 (1.0%)<br />
2.9M USD 3.7M USD<br />
605 545<br />
13 13 12 9 9 8<br />
10<br />
12 10 9 9 9 9 9 10 10 9 10 9 9 7 7 7 6 7<br />
Mar May Jul Sep Nov Jan Mar May Jul Sep Nov Jan Mar<br />
2019 2020 2021<br />
TRANSACTION<br />
Past 12 Months<br />
Past 3 Months<br />
2021 Mar 2020 Dec<br />
13 10<br />
3 3<br />
Source: AMSTAT & ASG<br />
FIRST QUARTER 2021 — ASIAN SKY QUARTERLY | 79
MARKET SUMMARY<br />
H155 & EC155B<br />
Average Asking Price<br />
EC155B<br />
Market Indicators (vs. Last Quarter)<br />
H155<br />
Average<br />
Transaction Level (Past 12 Months)<br />
H155<br />
EC155B<br />
$5.5<br />
Inventory Level<br />
$4.5<br />
$4.5<br />
$3.9<br />
$3.9<br />
$3.8<br />
$3.5<br />
Average Asking Price<br />
Average Days on Market<br />
$2.0 $2.0<br />
For Sale vs. Sold<br />
Sold For Sale<br />
$2.9<br />
$2.9<br />
$2.6 $2.6<br />
$2.6<br />
PERFORMANCE<br />
Max Range<br />
Max Speed<br />
Typ. Passengers<br />
H155<br />
516 N.M.<br />
955 km<br />
150 Knots<br />
13<br />
EC155B<br />
516 N.M.<br />
955 km<br />
135 Knots<br />
13<br />
1<br />
1<br />
1<br />
1<br />
1<br />
SUPPLY<br />
No. for Sale<br />
Avg Asking Price<br />
Avg Days on Market<br />
Mar | Dec<br />
9 | 10<br />
3.5M USD<br />
3.8M USD<br />
963 | 839<br />
Mar | Dec<br />
1 | 1<br />
2.6M USD<br />
2.6M USD<br />
784 | 694<br />
12 11 10 11 11 15 23 20 18 17<br />
18 16<br />
16<br />
16 16 16 16 17 16 15 12 11 11 10 10<br />
Mar May Jul Sep Nov Jan Mar May Jul Sep Nov Jan Mar<br />
2019 2020 2021<br />
TRANSACTION<br />
Past 12 Months<br />
Past 3 Months<br />
Mar | Dec<br />
0 | 0<br />
0 | 0<br />
Mar | Dec<br />
3 | 3<br />
0 | 1<br />
H225<br />
Average Asking Price<br />
Market Indicators (vs. Last Quarter)<br />
Transaction Level (Past 12 Months)<br />
$9.0<br />
Inventory Level<br />
$6.0<br />
$6.0<br />
$4.0<br />
$6.2<br />
$6.2<br />
$5.5<br />
Average Asking Price<br />
Average Days on Market<br />
For Sale vs. Sold<br />
PERFORMANCE<br />
Max Range<br />
Max Speed<br />
Typ. Passengers<br />
452 N.M. / 837 km<br />
142 Knots<br />
19<br />
Sold<br />
For Sale<br />
SUPPLY<br />
No. for Sale<br />
Avg Asking Price<br />
Avg Days on Market<br />
2021 Mar 2020 Dec<br />
11 (6.2%) 11 6.2%)<br />
5.5M USD 5.5M USD<br />
870 780<br />
13 13 13 13 13 13<br />
13<br />
12 12<br />
11<br />
11 9 9 11 10 9 8 9 9 9 11 11 11 11 11<br />
Mar May Jul Sep Nov Jan Mar May Jul Sep Nov Jan Mar<br />
2019 2020 2021<br />
TRANSACTION<br />
Past 12 Months<br />
Past 3 Months<br />
2021 Mar 2020 Dec<br />
0 0<br />
0 0<br />
80 | ASIAN SKY QUARTERLY — FIRST QUARTER 2021<br />
Source: AMSTAT & ASG
MARKET SUMMARY<br />
BELL 206 JETRANGER / LONGRANGER<br />
Average Asking Price<br />
Bell 206 LongRanger<br />
Bell 206 JetRanger<br />
Average<br />
Market Indicators (vs. Last Quarter)<br />
Bell 206JBell 206L<br />
Transaction Level (Past 12 Months)<br />
Inventory Level<br />
$0.9<br />
$0.9<br />
$0.8<br />
$0.9<br />
$0.9 $0.7<br />
$0.8<br />
Average Asking Price<br />
Average Days on Market<br />
$0.6<br />
$0.6<br />
For Sale vs. Sold<br />
Sold For Sale<br />
7<br />
9<br />
12<br />
17<br />
8 11<br />
4<br />
$0.6<br />
10<br />
4<br />
12<br />
15<br />
$0.5<br />
11 10 13<br />
10<br />
5<br />
$0.5<br />
2<br />
7<br />
10<br />
$0.5<br />
4<br />
13 14<br />
9<br />
6<br />
$0.5<br />
PERFORMANCE<br />
Max Range<br />
Max Speed<br />
Typ. Passengers<br />
SUPPLY<br />
No. for Sale<br />
Avg Asking Price<br />
Avg Days on Market<br />
Bell 206J<br />
374 N.M.<br />
693 km<br />
121 Knots<br />
4<br />
Mar | Dec<br />
133 | 133<br />
0.5M USD<br />
0.5M USD<br />
811 | 822<br />
Bell 206L<br />
270 N.M.<br />
500 km<br />
105 Knots<br />
6<br />
Mar | Dec<br />
62 | 82<br />
0.8M USD<br />
0.8M USD<br />
513 | 423<br />
195 202 209 207 205 204 202 200 187 195 200 210 205 203 203 202 201 201 200 221 222 215 197 205 195<br />
Mar May Jul Sep Nov Jan Mar May Jul Sep Nov Jan Mar<br />
2019 2020 2021<br />
TRANSACTION<br />
Past 12 Months<br />
Past 3 Months<br />
Mar | Dec<br />
86 | 71<br />
15 | 27<br />
Mar | Dec<br />
7 | 7<br />
0 | 4<br />
BELL 407<br />
Average Asking Price<br />
Market Indicators (vs. Last Quarter)<br />
Transaction Level (Past 12 Months)<br />
$2.4<br />
Inventory Level<br />
$2.3<br />
$2.3<br />
Average Asking Price<br />
$2.3<br />
Average Days on Market<br />
$2.0<br />
$2.0<br />
$2.2<br />
For Sale vs. Sold<br />
PERFORMANCE<br />
Max Range<br />
Max Speed<br />
Typ. Passengers<br />
323 N.M. / 598 km<br />
132 Knots<br />
7<br />
Sold<br />
For Sale<br />
5 7<br />
1 6 5 6<br />
3<br />
3<br />
5<br />
2<br />
4 4<br />
6 7<br />
3 3<br />
1<br />
2<br />
7<br />
2<br />
7 4<br />
6<br />
2 3<br />
SUPPLY<br />
No. for Sale<br />
Avg Asking Price<br />
Avg Days on Market<br />
2021 Mar 2020 Dec<br />
68 (4.2%) 68 (4.3%)<br />
2.2M USD 2.3M USD<br />
400 389<br />
41 38 41 43 44 39<br />
43<br />
44 49<br />
53<br />
51 46 46 49 49 52 60 60 60 64 66 68 67 71 68<br />
Mar May Jul Sep Nov Jan Mar May Jul Sep Nov Jan Mar<br />
2019 2020 2021<br />
TRANSACTION<br />
Past 12 Months<br />
Past 3 Months<br />
2021 Mar 2020 Dec<br />
48 37<br />
11 13<br />
Source: AMSTAT & ASG<br />
FIRST QUARTER 2021 — ASIAN SKY QUARTERLY | 81
MARKET SUMMARY<br />
BELL 412EP/412HP<br />
Average Asking Price<br />
Bell 412 HP<br />
Market Indicators (vs. Last Quarter)<br />
Bell 412 EP<br />
Average<br />
Transaction Level (Past 12 Months)<br />
Bell 412EPBell 412HP<br />
$5.6<br />
Inventory Level<br />
Average Asking Price<br />
$4.3 $4.5<br />
$3.0<br />
$2.0<br />
For Sale vs. Sold<br />
Sold For Sale<br />
$3.7<br />
$2.0<br />
$3.5<br />
$2.0<br />
$3.3<br />
$2.2 $2.2<br />
$3.1<br />
$2.2<br />
Average Days on Market<br />
PERFORMANCE<br />
Max Range<br />
Max Speed<br />
Typ. Passengers<br />
Bell 412EP<br />
356 N.M. /<br />
659 km<br />
140 Knots<br />
9<br />
Bell 412HP<br />
349 N.M. /<br />
646 km<br />
133 Knots<br />
14<br />
1<br />
1 2<br />
3 5<br />
2 1 3<br />
1<br />
2<br />
3<br />
2 3<br />
3<br />
1 1 1 1 1<br />
8<br />
SUPPLY<br />
No. for Sale<br />
Avg Asking Price<br />
Avg Days on Market<br />
Mar | Dec<br />
27 | 28<br />
3.1M USD<br />
3.1M USD<br />
421 | 326<br />
Mar | Dec<br />
46 | 46<br />
2.2M USD<br />
2.2M USD<br />
470 | 856<br />
36 34 33 31 28 27<br />
27<br />
26 26<br />
26<br />
27 25 27 23 23 23 23 27 27 29 29 30 31 29 29<br />
Mar May Jul Sep Nov Jan Mar May Jul Sep Nov Jan Mar<br />
2019 2020 2021<br />
TRANSACTION<br />
Past 12 Months<br />
Past 3 Months<br />
Mar | Dec<br />
18 | 8<br />
10 | 3<br />
Mar | Dec<br />
1 | 1<br />
0 | 0<br />
BELL 429<br />
Average Asking Price<br />
Market Indicators (vs. Last Quarter)<br />
$5.6<br />
Transaction Level (Past 12 Months)<br />
Inventory Level<br />
$4.9<br />
Average Asking Price<br />
Average Days on Market<br />
For Sale vs. Sold<br />
$4.7<br />
$4.4<br />
$4.1 $4.1<br />
$4.2<br />
PERFORMANCE<br />
Max Range<br />
Max Speed<br />
Typ. Passengers<br />
368 N.M. / 681 km<br />
130 Knots<br />
7<br />
Sold<br />
1<br />
For Sale<br />
2<br />
1 1 1<br />
15 17 20 21 20 21<br />
2<br />
1<br />
3<br />
4<br />
2<br />
2<br />
2 1<br />
21 24 24 21 20 17 14 14 15 16 18 18 14 15 14 12 9 8 9<br />
Mar May Jul Sep Nov Jan Mar May Jul Sep Nov Jan Mar<br />
2019 2020 2021<br />
1<br />
2<br />
3<br />
1<br />
SUPPLY<br />
No. for Sale<br />
Avg Asking Price<br />
Avg Days on Market<br />
TRANSACTION<br />
Past 12 Months<br />
Past 3 Months<br />
2021 Mar 2020 Dec<br />
9 (2.3%) 12 (3.2%)<br />
4.2M USD 4.1M USD<br />
406 391<br />
2021 Mar 2020 Dec<br />
12 8<br />
4 4<br />
82 | ASIAN SKY QUARTERLY — FIRST QUARTER 2021<br />
Source: AMSTAT & ASG
MARKET SUMMARY<br />
AW109SP GRANDNEW<br />
Average Asking Price<br />
Market Indicators (vs. Last Quarter)<br />
$4.8<br />
$4.5<br />
$4.7<br />
$4.6<br />
Transaction Level (Past 12 Months)<br />
Inventory Level<br />
Average Asking Price<br />
Average Days on Market<br />
$4.2<br />
For Sale vs. Sold<br />
$4.3 $4.3<br />
1<br />
5<br />
PERFORMANCE<br />
Max Range<br />
Max Speed<br />
Typ. Passengers<br />
480 N.M. / 889 km<br />
130 Knots<br />
7<br />
Sold For Sale<br />
1<br />
2<br />
2<br />
1<br />
1 1<br />
2<br />
1<br />
1 1<br />
7 7 8 8 8 9 8 12 10 10 9 11 12 15 17 17 16 18 19 22 22 19 15 16 14<br />
Mar May Jul Sep Nov Jan Mar May Jul Sep Nov Jan Mar<br />
2019 2020 2021<br />
SUPPLY<br />
No. for Sale<br />
Avg Asking Price<br />
Avg Days on Market<br />
TRANSACTION<br />
Past 12 Months<br />
Past 3 Months<br />
2021 Mar 2020 Dec<br />
14 (7.1%) 19 (9.8%)<br />
4.6M USD 4.3M USD<br />
307 256<br />
2021 Mar 2020 Dec<br />
11 9<br />
2 6<br />
AW139<br />
Average Asking Price<br />
Market Indicators (vs. Last Quarter)<br />
$7.5<br />
Transaction Level (Past 12 Months)<br />
Inventory Level<br />
$7.6<br />
$6.5<br />
$6.0<br />
$6.2<br />
$6.8<br />
Average Asking Price<br />
Average Days on Market<br />
For Sale vs. Sold<br />
$5.7<br />
PERFORMANCE<br />
Max Range<br />
Max Speed<br />
Typ. Passengers<br />
568 N.M. / 1,052 km<br />
140 Knots<br />
15<br />
1<br />
Sold<br />
1<br />
For Sale<br />
2 3<br />
4<br />
1<br />
3 1<br />
4<br />
2<br />
6<br />
1<br />
1<br />
2<br />
4<br />
1 1 1<br />
SUPPLY<br />
No. for Sale<br />
Avg Asking Price<br />
Avg Days on Market<br />
2021Mar<br />
32 (3.2%)<br />
6.8M USD<br />
466<br />
2020 Dec<br />
28 (2.9%)<br />
6.1M USD<br />
466<br />
27 26 23 23 26 23<br />
22<br />
22 23<br />
23<br />
22 24 23<br />
24 24 23<br />
24 31 27 28 29 28 31 31 32<br />
Mar May Jul Sep Nov Jan Mar May Jul Sep Nov Jan Mar<br />
2019 2020 2021<br />
TRANSACTION<br />
Past 12 Months<br />
Past 3 Months<br />
2021Mar<br />
11<br />
3<br />
2020 Dec<br />
8<br />
4<br />
Source: AMSTAT & ASG<br />
FIRST QUARTER 2021 — ASIAN SKY QUARTERLY | 83
MARKET SUMMARY<br />
S-76C+ / S-76C++<br />
Average Asking Price<br />
S76C+<br />
Market Indicators (vs. Last Quarter)<br />
$5.6<br />
$4.7<br />
$4.6<br />
$4.8<br />
$4.6<br />
S76C++<br />
Average<br />
S76C+<br />
Transaction Level (Past 12 Months)<br />
Inventory Level<br />
Average Asking Price<br />
S76C++<br />
$3.3<br />
Average Days on Market<br />
$2.0<br />
$2.0<br />
For Sale vs. Sold<br />
Sold For Sale<br />
$1.7<br />
$1.7<br />
$1.7<br />
$2.3<br />
$1.6<br />
$1.8<br />
PERFORMANCE<br />
Max Range<br />
Max Speed<br />
Typ. Passengers<br />
S-76C+<br />
335 N.M. /<br />
620 km<br />
155 Knots<br />
12<br />
S-76C++<br />
335 N.M. /<br />
620 km<br />
155 Knots<br />
12<br />
1<br />
1 1 1<br />
1<br />
1<br />
1 4 1<br />
1<br />
2<br />
SUPPLY<br />
No. for Sale<br />
Avg Asking Price<br />
Avg Days on Market<br />
Mar | Dec<br />
14 | 20<br />
1.8M USD<br />
1.7M USD<br />
815 | 719<br />
Mar | Dec<br />
13 | 19<br />
3.3M USD<br />
2.2M USD<br />
493 | 580<br />
47 42 45 41 41 45<br />
45 44 45 45 44 41 40 43 43 44 43 45 44 42 44 39 42 32 27<br />
Mar May Jul Sep Nov Jan Mar May Jul Sep Nov Jan Mar<br />
2019 2020 2021<br />
TRANSACTION<br />
Past 12 Months<br />
Past 3 Months<br />
Mar | Dec<br />
0 | 0<br />
0 | 0<br />
Mar | Dec<br />
9 | 6<br />
3 | 5<br />
FEATURED AIRCRAFT<br />
Source: AMSTAT & ASG<br />
AGUSTAWESTLAND - AW139 SN60001<br />
TOTAL HOURS: 384 HOURS SINCE NEW<br />
• 2+6 Leather Seats VIP Configuration w/ Conversion Kit for 8 Passengers<br />
• Incrased Gross Weight - 6,800 KG<br />
• Air Conditioning System<br />
• Super Silent Soundproofing<br />
• Emergency Floats (Fixed Parts)<br />
• Wire Strike Protection System<br />
• Passenger Cabin Hinged Doors<br />
• Anti-icing System<br />
AIRBUS - AS350B2 SN3275<br />
TOTAL HOURS: 4,210 SINCE NEW<br />
• 1 + 5 Seating Configuration<br />
• Always Hangared<br />
• <strong>Sky</strong>Trac Satellite Tracking<br />
• Aerazur Emergency Floatation System<br />
• Dual Cyclic Controls<br />
• Dual Collective Control with Twist Grip<br />
84 | ASIAN SKY QUARTERLY — FIRST QUARTER 2021
MARKET SUMMARY<br />
RENOWNED LEGAL<br />
ADVISERS FOR ALL YOUR<br />
BUSINESS AVIATION NEEDS<br />
#1<br />
Aviation<br />
Law Firm<br />
of the Year<br />
Full service<br />
aviation team<br />
Liability, disputes, finance,<br />
leasing, commercial and<br />
regulatory<br />
2020, 2019<br />
China Business Law Journal<br />
2019<br />
Hong Kong Aviation Law<br />
Firm of the Year, <strong>Asian</strong><br />
Legal Business<br />
25+<br />
APAC lawyers<br />
Largest aviation team<br />
in Asia Pacific<br />
Finance/Leasing<br />
JUSTIN SUN<br />
Registered Foreign Lawyer, Hong Kong<br />
T +852 3983 7713<br />
E justin.sun@hfw.com<br />
LING LUI<br />
Partner, Singapore<br />
T +65 6411 5201<br />
E ling.lui@hfw.com<br />
Claims/Commercial/Regulatory<br />
GORDON GARDINER<br />
Partner, Hong Kong<br />
T +852 3983 7710<br />
E gordon.gardiner@hfw.com<br />
JAMES JORDAN<br />
Senior Associate, Singapore<br />
T +65 6411 5374<br />
E james.jordan@hfw.com<br />
www.hfw.com/aerospace<br />
Americas | Europe | Middle East | Asia Pacific<br />
FIRST QUARTER 2021 — ASIAN SKY QUARTERLY | 85
SPECIAL FEATURE: ASIA-PACIFIC FLIGHT ACTIVITY - A YEAR IN REVIEW<br />
DC AviAtion Al-FuttAim unites quAlity mADe in<br />
GermAny AnD ArAbiC HospitAlity<br />
In everything we do, our goal is not only to meet your expectations but to<br />
surpass them. Our unrivalled FBO and VIP hangar facilities located at Dubai South<br />
guarantee your utmost discretion, comfort and convenience every time you fly.<br />
Reach out to the team today to experience our passion for excellence.<br />
T: +971 (0)4 870 1800 | www.dc-aviation.ae | An Al-Futtaim Joint Venture<br />
Al Maktoum International Airport | DWC | Aviation District | Dubai, UAE<br />
86 | ASIAN SKY QUARTERLY — FIRST QUARTER 2021