Asian Sky Quarterly 2021Q1

Create successful ePaper yourself
Turn your PDF publications into a flip-book with our unique Google optimized e-Paper software.
ECONOMICS<br />
SOUTHEAST ASIA | THAILAND, MALAYSIA & SINGAPORE<br />
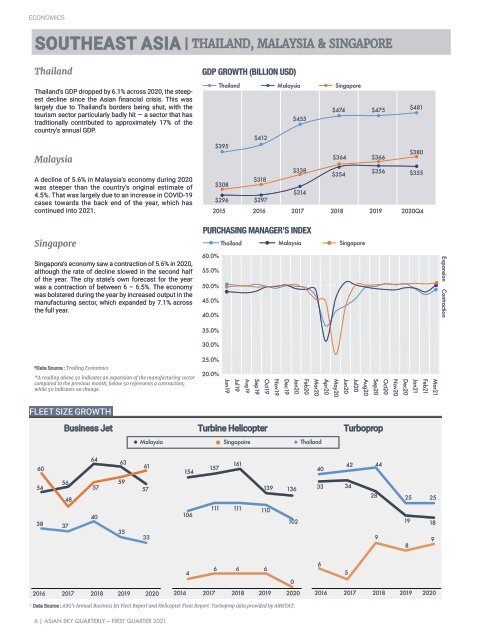
Thailand<br />
Thailand’s GDP dropped by 6.1% across 2020, the steepest<br />
decline since the <strong>Asian</strong> financial crisis. This was<br />
largely due to Thailand’s borders being shut, with the<br />
tourism sector particularly badly hit — a sector that has<br />
traditionally contributed to approximately 17% of the<br />
country’s annual GDP.<br />
Malaysia<br />
A decline of 5.6% in Malaysia’s economy during 2020<br />
was steeper than the country’s original estimate of<br />
4.5%. That was largely due to an increase in COVID-19<br />
cases towards the back end of the year, which has<br />
continued into 2021.<br />
Singapore<br />
Singapore’s economy saw a contraction of 5.6% in 2020,<br />
although the rate of decline slowed in the second half<br />
of the year. The city state’s own forecast for the year<br />
was a contraction of between 6 – 6.5%. The economy<br />
was bolstered during the year by increased output in the<br />
manufacturing sector, which expanded by 7.1% across<br />
the full year.<br />
GDP GROWTH (BILLION USD)<br />
Thailand<br />
Malaysia<br />
Singapore<br />
$474 $475<br />
$481<br />
$455<br />
$412<br />
$395<br />
$380<br />
$364 $366<br />
$338<br />
$354<br />
$356 $355<br />
$318<br />
$308<br />
$314<br />
$296 $297<br />
2015 2016 2017 2018 2019 2020Q4<br />
PURCHASING MANAGER’S INDEX<br />
Thailand Malaysia Singapore<br />
60.0%<br />
55.0%<br />
50.0%<br />
45.0%<br />
40.0%<br />
Expansion Contraction<br />
35.0%<br />
30.0%<br />
25.0%<br />
*Data Source : Trading Economics<br />
*A reading above 50 indicates an expansion of the manufacturing sector<br />
compared to the previous month; below 50 represents a contraction;<br />
while 50 indicates no change.<br />
20.0%<br />
Jun19<br />
Jul19<br />
Aug19<br />
Sep19<br />
Oct19<br />
Nov19<br />
Dec19<br />
Jan20<br />
Feb20<br />
Mar20<br />
Apr20<br />
May20<br />
Jun20<br />
Jul20<br />
Aug20<br />
Sep20<br />
Oct20<br />
Nov20<br />
Dec20<br />
Jan21<br />
Feb21<br />
Mar21<br />
FLEET SIZE GROWTH<br />
Business Jet<br />
Turbine Helicopter<br />
Malaysia Singapoire Thailand<br />
Turboprop<br />
60<br />
64<br />
63<br />
61<br />
154<br />
157<br />
161<br />
40<br />
42<br />
44<br />
54<br />
56<br />
59<br />
57<br />
57<br />
139 136<br />
33<br />
48<br />
111 111 110<br />
40<br />
106<br />
38<br />
102<br />
37<br />
35<br />
33<br />
34<br />
28<br />
9<br />
25<br />
19<br />
8<br />
25<br />
18<br />
9<br />
2016 2017 2018 2019 2020 2016 2017 2018 2019 2020 2016 2017 2018 2019 2020<br />
* Data Source : ASG's Annual Business Jet Fleet Report and Helicopter Fleet Report. Turboprop data provided by AMSTAT.<br />
4<br />
6<br />
6<br />
6<br />
0<br />
6<br />
5<br />
6 | ASIAN SKY QUARTERLY — FIRST QUARTER 2021