Asian Sky Quarterly 2021Q1

Create successful ePaper yourself
Turn your PDF publications into a flip-book with our unique Google optimized e-Paper software.
COMMENTARY: GLOBAL JET CAPITAL<br />
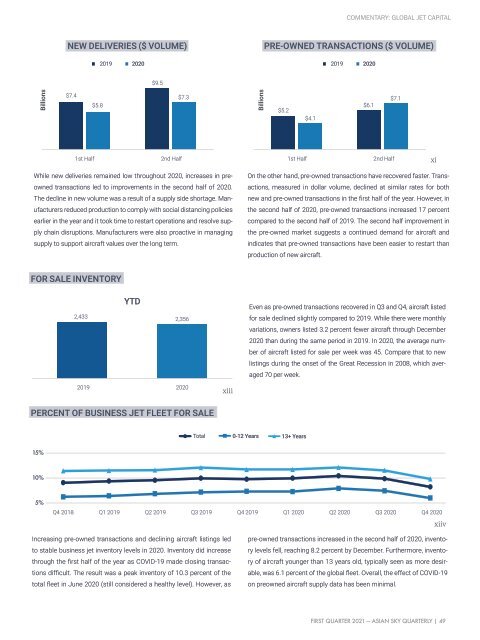
NEW DELIVERIES ($ VOLUME)<br />
PRE-OWNED TRANSACTIONS ($ VOLUME)<br />
2019 2020 2019 2020<br />
$9.5<br />
Billions<br />
$7.4<br />
$5.8<br />
$7.3<br />
Billions<br />
$5.2<br />
$4.1<br />
$6.1<br />
$7.1<br />
1st Half 2nd Half 1st Half 2nd Half<br />
xi<br />
While new deliveries remained low throughout 2020, increases in preowned<br />
transactions led to improvements in the second half of 2020.<br />
The decline in new volume was a result of a supply side shortage. Manufacturers<br />
reduced production to comply with social distancing policies<br />
earlier in the year and it took time to restart operations and resolve supply<br />
chain disruptions. Manufacturers were also proactive in managing<br />
supply to support aircraft values over the long term.<br />
On the other hand, pre-owned transactions have recovered faster. Transactions,<br />
measured in dollar volume, declined at similar rates for both<br />
new and pre-owned transactions in the first half of the year. However, in<br />
the second half of 2020, pre-owned transactions increased 17 percent<br />
compared to the second half of 2019. The second half improvement in<br />
the pre-owned market suggests a continued demand for aircraft and<br />
indicates that pre-owned transactions have been easier to restart than<br />
production of new aircraft.<br />
FOR SALE INVENTORY<br />
2,433<br />
YTD<br />
2,356<br />
Even as pre-owned transactions recovered in Q3 and Q4, aircraft listed<br />
for sale declined slightly compared to 2019. While there were monthly<br />
variations, owners listed 3.2 percent fewer aircraft through December<br />
2020 than during the same period in 2019. In 2020, the average number<br />
of aircraft listed for sale per week was 45. Compare that to new<br />
listings during the onset of the Great Recession in 2008, which averaged<br />
70 per week.<br />
2019 2020<br />
xiii<br />
PERCENT OF BUSINESS JET FLEET FOR SALE<br />
Total 0-12 Years 13+ Years<br />
15%<br />
10%<br />
5%<br />
Q4 2018<br />
Q1 2019 Q2 2019 Q3 2019 Q4 2019 Q1 2020 Q2 2020 Q3 2020 Q4 2020<br />
xiiv<br />
Increasing pre-owned transactions and declining aircraft listings led<br />
to stable business jet inventory levels in 2020. Inventory did increase<br />
through the first half of the year as COVID-19 made closing transactions<br />
difficult. The result was a peak inventory of 10.3 percent of the<br />
total fleet in June 2020 (still considered a healthy level). However, as<br />
pre-owned transactions increased in the second half of 2020, inventory<br />
levels fell, reaching 8.2 percent by December. Furthermore, inventory<br />
of aircraft younger than 13 years old, typically seen as more desirable,<br />
was 6.1 percent of the global fleet. Overall, the effect of COVID-19<br />
on preowned aircraft supply data has been minimal.<br />
FIRST QUARTER 2021 — ASIAN SKY QUARTERLY | 49