Laboratoire National des Champs Magnétiques Pulsés CNRS – INSA
Laboratoire National des Champs Magnétiques Pulsés CNRS – INSA
Laboratoire National des Champs Magnétiques Pulsés CNRS – INSA

You also want an ePaper? Increase the reach of your titles
YUMPU automatically turns print PDFs into web optimized ePapers that Google loves.
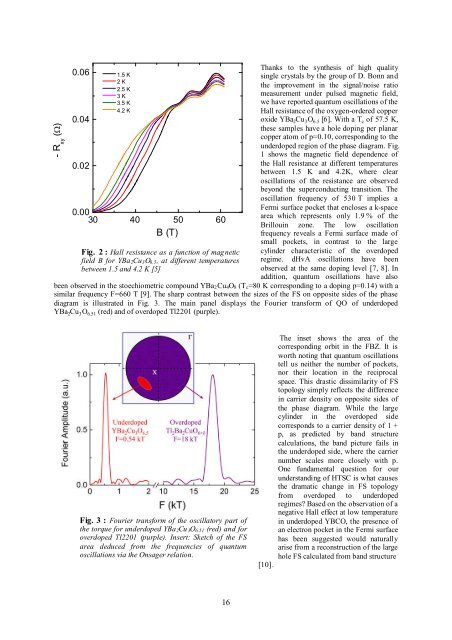
- R xy (�)<br />
0.06 1.5 K<br />
2 K<br />
2.5 K<br />
3 K<br />
3.5 K<br />
4.2 K<br />
0.04<br />
0.02<br />
0.00<br />
30 40 50<br />
B (T)<br />
60<br />
Fig. 2 : Hall resistance as a function of magnetic<br />
field B for YBa2Cu3O6.5, at different temperatures<br />
between 1.5 and 4.2 K [5]<br />
16<br />
Thanks to the synthesis of high quality<br />
single crystals by the group of D. Bonn and<br />
the improvement in the signal/noise ratio<br />
measurement under pulsed magnetic field,<br />
we have reported quantum oscillations of the<br />
Hall resistance of the oxygen-ordered copper<br />
oxide YBa 2Cu 3O 6.5 [6]. With a T c of 57.5 K,<br />
these samples have a hole doping per planar<br />
copper atom of p=0.10, corresponding to the<br />
underdoped region of the phase diagram. Fig.<br />
1 shows the magnetic field dependence of<br />
the Hall resistance at different temperatures<br />
between 1.5 K and 4.2K, where clear<br />
oscillations of the resistance are observed<br />
beyond the superconducting transition. The<br />
oscillation frequency of 530 T implies a<br />
Fermi surface pocket that encloses a k-space<br />
area which represents only 1.9 % of the<br />
Brillouin zone. The low oscillation<br />
frequency reveals a Fermi surface made of<br />
small pockets, in contrast to the large<br />
cylinder characteristic of the overdoped<br />
regime. dHvA oscillations have been<br />
observed at the same doping level [7, 8]. In<br />
addition, quantum oscillations have also<br />
been observed in the stoechiometric compound YBa2Cu4O8 (Tc=80 K corresponding to a doping p=0.14) with a<br />
similar frequency F=660 T [9]. The sharp contrast between the sizes of the FS on opposite si<strong>des</strong> of the phase<br />
diagram is illustrated in Fig. 3. The main panel displays the Fourier transform of QO of underdoped<br />
YBa 2Cu 3O 6.51 (red) and of overdoped Tl2201 (purple).<br />
Fig. 3 : Fourier transform of the oscillatory part of<br />
the torque for underdoped YBa2Cu3O6.51 (red) and for<br />
overdoped Tl2201 (purple). Insert: Sketch of the FS<br />
area deduced from the frequencies of quantum<br />
oscillations via the Onsager relation.<br />
[10].<br />
The inset shows the area of the<br />
corresponding orbit in the FBZ. It is<br />
worth noting that quantum oscillations<br />
tell us neither the number of pockets,<br />
nor their location in the reciprocal<br />
space. This drastic dissimilarity of FS<br />
topology simply reflects the difference<br />
in carrier density on opposite si<strong>des</strong> of<br />
the phase diagram. While the large<br />
cylinder in the overdoped side<br />
corresponds to a carrier density of 1 +<br />
p, as predicted by band structure<br />
calculations, the band picture fails in<br />
the underdoped side, where the carrier<br />
number scales more closely with p.<br />
One fundamental question for our<br />
understanding of HTSC is what causes<br />
the dramatic change in FS topology<br />
from overdoped to underdoped<br />
regimes? Based on the observation of a<br />
negative Hall effect at low temperature<br />
in underdoped YBCO, the presence of<br />
an electron pocket in the Fermi surface<br />
has been suggested would naturally<br />
arise from a reconstruction of the large<br />
hole FS calculated from band structure